Hyllestad in figures
A card for sharing, for example on LinkedIn. The same figures as the municipality page, with source and year.
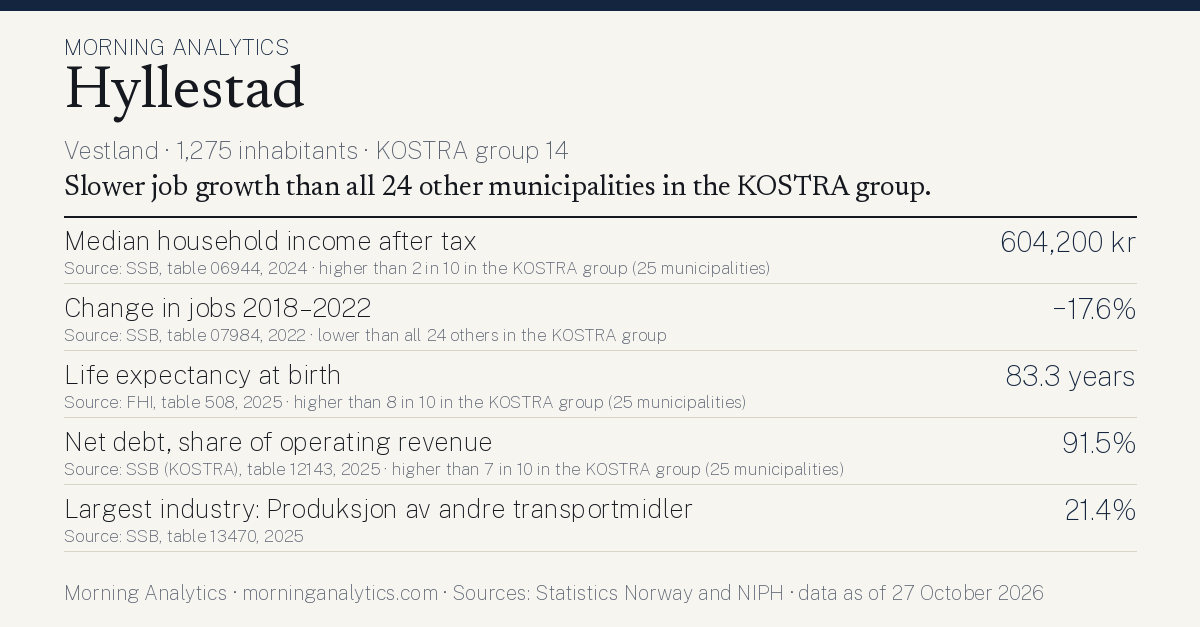
The figures on the card
Slower job growth than all 24 other municipalities in the KOSTRA group.
- Median household income after tax
- 604,200 kr Source: SSB, table 06944, 2024 · higher than 2 in 10 in the KOSTRA group (25 municipalities)
- Change in jobs 2018–2022
- −17.6% Source: SSB, table 07984, 2022 · lower than all 24 others in the KOSTRA group
- Life expectancy at birth
- 83.3 years Source: FHI, table 508, 2025 · higher than 8 in 10 in the KOSTRA group (25 municipalities)
- Net debt, share of operating revenue
- 91.5% Source: SSB (KOSTRA), table 12143, 2025 · higher than 7 in 10 in the KOSTRA group (25 municipalities)
- Largest industry: Produksjon av andre transportmidler
- 21.4% Source: SSB, table 13470, 2025
“Comparable municipalities” is the municipality's KOSTRA group at Statistics Norway. The sentence is chosen by fixed rules: the figure where the municipality is furthest from the middle of its group. No judgement of what is good or bad.