Highest and lowest level of education
The share of inhabitants with university or college education.
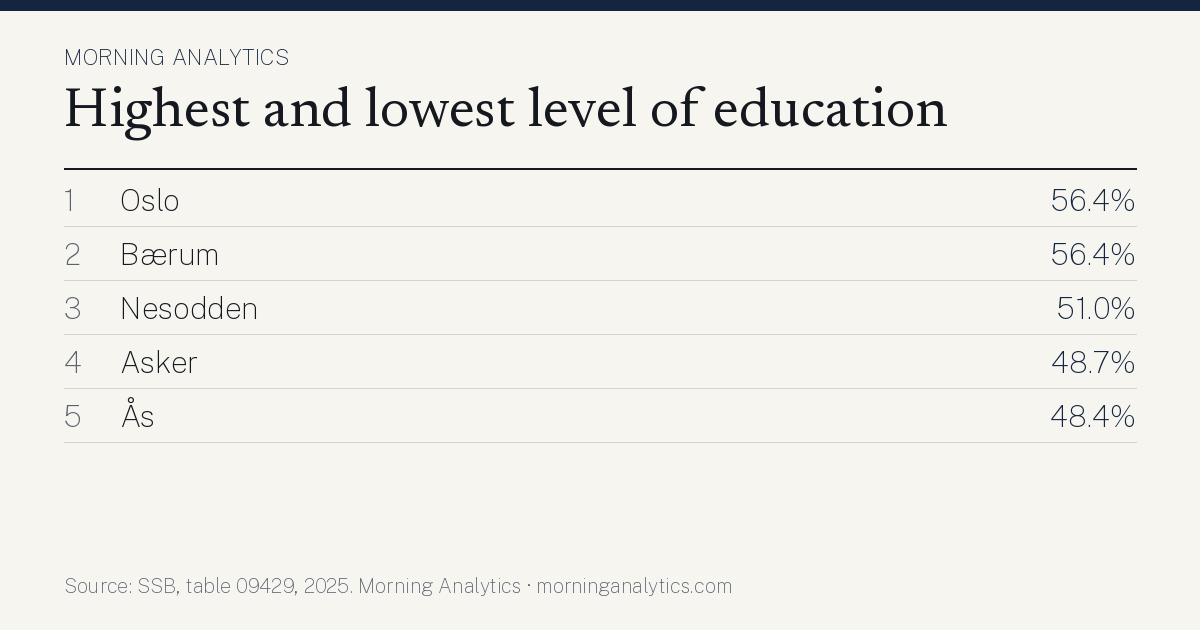
Oslo has the highest share with higher education of Norway's municipalities at 56.4% (2025). The lowest is Værøy at 16.7%. Source: SSB, table 09429, processed by Morning Analytics 2 November 2026.
Download the table (CSV) Sharing image (PNG)
Analysis: why are some at the top and others at the bottom?
We compared share with higher education with every other municipal figure we have, from Statistics Norway, NIPH and the Brønnøysund Register Centre. Below are the figures that go most closely together with share with higher education across the country, and what marks the municipalities at the top and bottom on those figures.
The pattern across the country
- Municipalities that rank high on «Detached houses, share of all dwellings» most often rank low on share with higher education (strong association, rank correlation −0.62 across 357 municipalities; Statistics Norway table 06265).
- Municipalities that rank high on «Gross income per person aged 17 and over, median» most often also rank high on share with higher education (strong association, rank correlation 0.56 across 357 municipalities; Statistics Norway table 05671).
- Municipalities that rank high on «Population on 1 January» most often also rank high on share with higher education (strong association, rank correlation 0.53 across 357 municipalities; Statistics Norway table 11342).
- Municipalities that rank high on «Share aged 80 and over» most often rank low on share with higher education (moderate association, rank correlation −0.48 across 357 municipalities; Statistics Norway table 07459).
The highest and the lowest
- No. 1 Oslo (56.4%) Fits the pattern: «Detached houses, share of all dwellings» 7.9% (no. 357 of 357 from the top; Statistics Norway table 06265); «Population on 1 January» 728,714 (no. 1 of 357 from the top; Statistics Norway table 11342); «Gross income per person aged 17 and over, median» 587,100 kr (no. 6 of 357 from the top; Statistics Norway table 05671). Most distinctive industry: tjenester tilknyttet informasjonsteknologi, 6% of the jobs, 2.6 times the national share (Statistics Norway table 13470, 2025).
- No. 2 Bærum (56.4%) Fits the pattern: «Gross income per person aged 17 and over, median» 638,400 kr (no. 1 of 357 from the top; Statistics Norway table 05671); «Detached houses, share of all dwellings» 28.8% (no. 353 of 357 from the top; Statistics Norway table 06265); «Population on 1 January» 133,228 (no. 5 of 357 from the top; Statistics Norway table 11342). Most distinctive industry: arkitektvirksomhet og teknisk konsulentvirksomhet, og teknisk prøving og analyse, 7% of the jobs, 3.4 times the national share (Statistics Norway table 13470, 2025).
- No. 3 Nesodden (51.0%) Fits the pattern: «Gross income per person aged 17 and over, median» 574,200 kr (no. 8 of 357 from the top; Statistics Norway table 05671); «Share aged 80 and over» 4.5% (no. 321 of 357 from the top; Statistics Norway table 07459); «Detached houses, share of all dwellings» 57.4% (no. 302 of 357 from the top; Statistics Norway table 06265). Most distinctive industry: helsetjenester, 17% of the jobs, 1.9 times the national share (Statistics Norway table 13470, 2025).
- No. 357 Værøy (16.7%, among the lowest) Fits the pattern: «Population on 1 January» 656 (no. 348 of 357 from the top; Statistics Norway table 11342); «Gross income per person aged 17 and over, median» 463,800 kr (no. 310 of 357 from the top; Statistics Norway table 05671); «Share aged 80 and over» 7.3% (no. 88 of 357 from the top; Statistics Norway table 07459). Most distinctive industry: produksjon av nærings- og nytelsesmidler, 31% of the jobs, 18.7 times the national share (Statistics Norway table 13470, 2025).
- No. 356 Berlevåg (18.3%, among the lowest) Fits the pattern: «Population on 1 January» 864 (no. 343 of 357 from the top; Statistics Norway table 11342); «Gross income per person aged 17 and over, median» 454,100 kr (no. 331 of 357 from the top; Statistics Norway table 05671). Most distinctive industry: fiske, fangst og akvakultur, 17% of the jobs, 21.4 times the national share (Statistics Norway table 13470, 2025).
- No. 355 Røst (18.5%, among the lowest) Fits the pattern: «Population on 1 January» 471 (no. 353 of 357 from the top; Statistics Norway table 11342); «Detached houses, share of all dwellings» 85.9% (no. 38 of 357 from the top; Statistics Norway table 06265). Most distinctive industry: fiske, fangst og akvakultur, 18% of the jobs, 22.1 times the national share (Statistics Norway table 13470, 2025).
The analysis describes what goes together, not what causes what. Two figures can follow each other because both depend on something else, such as size, location or industry. The figures are from the latest year available for each source, so the years can differ. Rank correlation runs from −1 to 1; values near 1 mean the municipalities lie in roughly the same order on both measures.
What explains the placing?
- 1. Oslo 56.4% 105% above the median of the municipalities.
- 2. Bærum 56.4% 105% above the median of the municipalities.
- 3. Nesodden 51.0% 85% above the median of the municipalities.
- 355. Røst 18.5% Small municipality (471 inhabitants): one company or a few people can move the figure a lot. 33% below the median of the municipalities.
- 356. Berlevåg 18.3% Small municipality (864 inhabitants): one company or a few people can move the figure a lot. 33% below the median of the municipalities.
- 357. Værøy 16.7% Small municipality (656 inhabitants): one company or a few people can move the figure a lot. 39% below the median of the municipalities.
| # | Municipality | share with higher education |
|---|---|---|
| 1 | Oslo | 56.4% |
| 2 | Bærum | 56.4% |
| 3 | Nesodden | 51.0% |
| 4 | Asker | 48.7% |
| 5 | Ås | 48.4% |
| 6 | Trondheim | 48.0% |
| 7 | Stavanger | 46.9% |
| 8 | Tromsø | 46.9% |
| 9 | Bergen | 46.8% |
| 10 | Nordre Follo | 44.9% |
| 11 | Lillehammer | 44.3% |
| 12 | Sogndal | 43.5% |
| 13 | Hamar | 43.1% |
| 14 | Hole | 42.4% |
| 15 | Volda | 41.9% |
| 16 | Frogn | 41.3% |
| 17 | Bodø | 41.1% |
| 18 | Kongsberg | 41.0% |
| 19 | Sola | 40.9% |
| 20 | Færder | 40.8% |
| 21 | Nittedal | 39.8% |
| 22 | Kristiansand | 39.8% |
| 23 | Malvik | 39.8% |
| 24 | Lier | 39.6% |
| 25 | Lørenskog | 39.5% |
| 26 | Molde | 39.2% |
| 27 | Tønsberg | 39.1% |
| 28 | Ålesund | 38.6% |
| 29 | Sandnes | 38.1% |
| 30 | Grimstad | 38.0% |
| 31 | Levanger | 37.8% |
| 32 | Vestby | 37.7% |
| 33 | Karasjoksmall municipality | 37.1% |
| 34 | Hemsedalsmall municipality | 37.0% |
| 35 | Ulstein | 36.6% |
| 36 | Haugesund | 36.6% |
| 37 | Lillestrøm | 36.5% |
| 38 | Rælingen | 36.5% |
| 39 | Lillesand | 36.4% |
| 40 | Randaberg | 36.1% |
| 41 | Sunnfjord | 36.0% |
| 42 | Horten | 35.8% |
| 43 | Vadsø | 35.8% |
| 44 | Gloppen | 35.6% |
| 45 | Harstad | 35.6% |
| 46 | Midt-Telemark | 35.5% |
| 47 | Tolgasmall municipality | 35.3% |
| 48 | Byklesmall municipality | 35.0% |
| 49 | Moss | 34.8% |
| 50 | Drammen | 34.8% |