Most and fewest new businesses
New enterprises per 1,000 inhabitants.
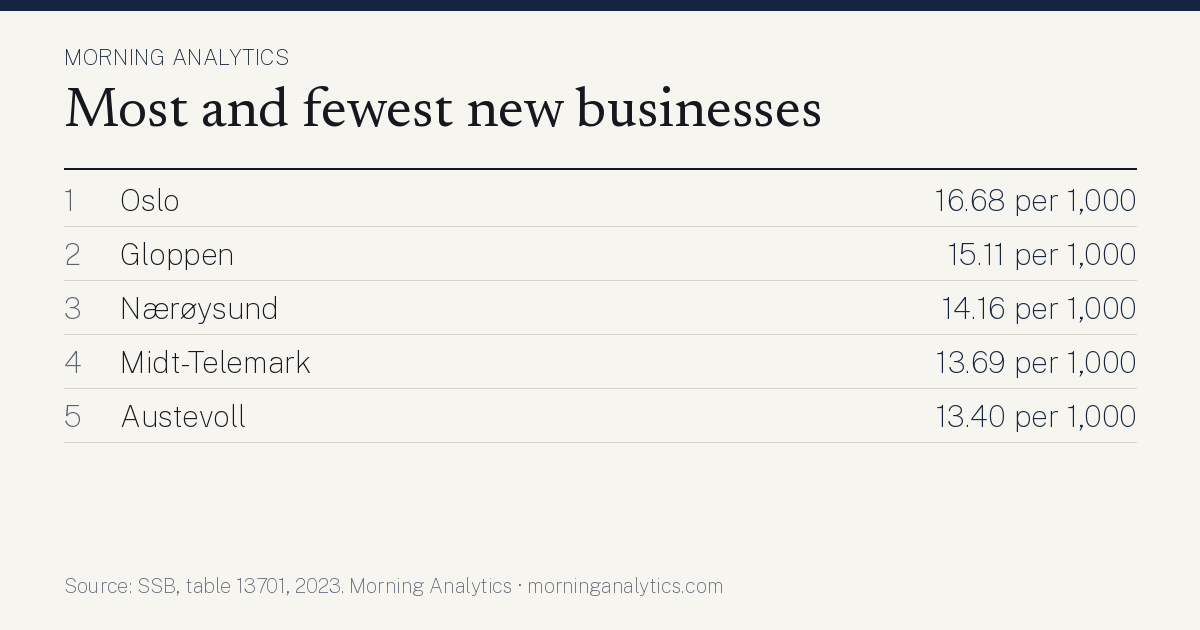
Oslo has the highest new enterprises per 1,000 inhabitants of Norway's municipalities at 16.68 per 1,000 (2023). The lowest is Årdal at 5.03 per 1,000. Source: SSB, table 13701, processed by Morning Analytics 3 November 2026.
Download the table (CSV) Sharing image (PNG)
The picture in figures
The bars show the ten highest and the ten lowest of 181 municipalities. The dashed line is the median of all municipalities.
Each bar is the number of municipalities in a range of values. The dashed line is the median. Hover over a bar to see the range.
Analysis: why are some at the top and others at the bottom?
We compared new enterprises per 1,000 inhabitants with every other municipal figure we have, from Statistics Norway, NIPH and the Brønnøysund Register Centre. Below are the figures that go most closely together with new enterprises per 1,000 inhabitants across the country, and what marks the municipalities at the top and bottom on those figures.
The pattern across the country
- Municipalities that rank high on «Limited companies we follow per 1,000 inhabitants» most often also rank high on new enterprises per 1,000 inhabitants (moderate association, rank correlation 0.47 across 181 municipalities; Brønnøysund Register Centre, our own calculations).
- Municipalities that rank high on «Projected population growth to 2050 (main alternative)» most often also rank high on new enterprises per 1,000 inhabitants (moderate association, rank correlation 0.45 across 181 municipalities; Statistics Norway table 14746).
- Municipalities that rank high on «Share in households with persistent low income (EU60)» most often also rank high on new enterprises per 1,000 inhabitants (moderate association, rank correlation 0.43 across 181 municipalities; NIPH indicator 403).
- Municipalities that rank high on «Centrality (Statistics Norway's centrality index, 6 is most central)» most often also rank high on new enterprises per 1,000 inhabitants (moderate association, rank correlation 0.34 across 181 municipalities; Statistics Norway, centrality index).
The highest and the lowest
- No. 1 Oslo (16.68 per 1,000) Fits the pattern: «Share in households with persistent low income (EU60)» 14.4% (no. 1 of 357 from the top; NIPH indicator 403); «Centrality (Statistics Norway's centrality index, 6 is most central)» 6 (no. 1 of 357 from the top; Statistics Norway, centrality index); «Limited companies we follow per 1,000 inhabitants» 93.52 per 1,000 (no. 26 of 347 from the top; Brønnøysund Register Centre, our own calculations). Most distinctive industry: tjenester tilknyttet informasjonsteknologi, 6% of the jobs, 2.6 times the national share (Statistics Norway table 13470, 2025).
- No. 2 Gloppen (15.11 per 1,000) Fits the pattern: «Limited companies we follow per 1,000 inhabitants» 72.62 per 1,000 (no. 85 of 347 from the top; Brønnøysund Register Centre, our own calculations). Goes against the pattern: «Projected population growth to 2050 (main alternative)» −4.0% (no. 286 of 357 from the top; Statistics Norway table 14746). Most distinctive industry: jordbruk og tjenester tilknyttet jordbruk, jakt og viltstell, 7% of the jobs, 5.2 times the national share (Statistics Norway table 13470, 2025).
- No. 3 Nærøysund (14.16 per 1,000) Fits the pattern: «Limited companies we follow per 1,000 inhabitants» 75.40 per 1,000 (no. 72 of 347 from the top; Brønnøysund Register Centre, our own calculations). Most distinctive industry: fiske, fangst og akvakultur, 14% of the jobs, 17.3 times the national share (Statistics Norway table 13470, 2025).
- No. 181 Årdal (5.03 per 1,000, among the lowest) Fits the pattern: «Projected population growth to 2050 (main alternative)» −15.4% (no. 354 of 357 from the top; Statistics Norway table 14746); «Share in households with persistent low income (EU60)» 5.8% (no. 350 of 357 from the top; NIPH indicator 403); «Limited companies we follow per 1,000 inhabitants» 41.33 per 1,000 (no. 323 of 347 from the top; Brønnøysund Register Centre, our own calculations). Most distinctive industry: produksjon av metaller, 35% of the jobs, 90.8 times the national share (Statistics Norway table 13470, 2025).
- No. 180 Tynset (5.15 per 1,000, among the lowest) The municipality does not stand out on the figures that otherwise go together with the measure. The explanation probably lies in something we have no figures for. Most distinctive industry: jordbruk og tjenester tilknyttet jordbruk, jakt og viltstell, 8% of the jobs, 6.3 times the national share (Statistics Norway table 13470, 2025).
- No. 179 Nome (6.10 per 1,000, among the lowest) Fits the pattern: «Limited companies we follow per 1,000 inhabitants» 46.87 per 1,000 (no. 289 of 347 from the top; Brønnøysund Register Centre, our own calculations); «Share in households with persistent low income (EU60)» 7.2% (no. 281 of 357 from the top; NIPH indicator 403). Goes against the pattern: «Centrality (Statistics Norway's centrality index, 6 is most central)» 3 (no. 81 of 357 from the top; Statistics Norway, centrality index). Most distinctive industry: produksjon av metaller, 7% of the jobs, 17.1 times the national share (Statistics Norway table 13470, 2025).
The analysis describes what goes together, not what causes what. Two figures can follow each other because both depend on something else, such as size, location or industry. The figures are from the latest year available for each source, so the years can differ. Rank correlation runs from −1 to 1; values near 1 mean the municipalities lie in roughly the same order on both measures.
What explains the placing?
- 1. Oslo 16.68 per 1,000 78% above the median of the municipalities.
- 2. Gloppen 15.11 per 1,000 61% above the median of the municipalities.
- 3. Nærøysund 14.16 per 1,000 51% above the median of the municipalities.
- 179. Nome 6.10 per 1,000 35% below the median of the municipalities.
- 180. Tynset 5.15 per 1,000 45% below the median of the municipalities.
- 181. Årdal 5.03 per 1,000 46% below the median of the municipalities.
| # | Municipality | new enterprises per 1,000 inhabitants |
|---|---|---|
| 101 | Frøya | 9.09 per 1,000 |
| 102 | Bodø | 9.09 per 1,000 |
| 103 | Øvre Eiker | 9.08 per 1,000 |
| 104 | Horten | 9.00 per 1,000 |
| 105 | Nes | 8.94 per 1,000 |
| 106 | Gran | 8.92 per 1,000 |
| 107 | Kristiansund | 8.90 per 1,000 |
| 108 | Sveio | 8.90 per 1,000 |
| 109 | Sarpsborg | 8.82 per 1,000 |
| 110 | Nordre Land | 8.73 per 1,000 |
| 111 | Sogndal | 8.69 per 1,000 |
| 112 | Inderøy | 8.62 per 1,000 |
| 113 | Nittedal | 8.57 per 1,000 |
| 114 | Klepp | 8.54 per 1,000 |
| 115 | Molde | 8.54 per 1,000 |
| 116 | Hareid | 8.53 per 1,000 |
| 117 | Ørland | 8.50 per 1,000 |
| 118 | Orkland | 8.45 per 1,000 |
| 119 | Tysvær | 8.42 per 1,000 |
| 120 | Lunner | 8.38 per 1,000 |
| 121 | Namsos | 8.38 per 1,000 |
| 122 | Skien | 8.33 per 1,000 |
| 123 | Østre Toten | 8.32 per 1,000 |
| 124 | Senja | 8.28 per 1,000 |
| 125 | Målselv | 8.26 per 1,000 |
| 126 | Stjørdal | 8.19 per 1,000 |
| 127 | Alver | 8.19 per 1,000 |
| 128 | Askøy | 8.17 per 1,000 |
| 129 | Heim | 8.16 per 1,000 |
| 130 | Elverum | 8.11 per 1,000 |
| 131 | Karmøy | 8.04 per 1,000 |
| 132 | Herøy (Møre og Romsdal) | 8.03 per 1,000 |
| 133 | Indre Fosen | 8.02 per 1,000 |
| 134 | Narvik | 7.99 per 1,000 |
| 135 | Kongsberg | 7.99 per 1,000 |
| 136 | Eidskog | 7.96 per 1,000 |
| 137 | Hitra | 7.95 per 1,000 |
| 138 | Sør-Odal | 7.93 per 1,000 |
| 139 | Bømlo | 7.91 per 1,000 |
| 140 | Farsund | 7.91 per 1,000 |
| 141 | Randaberg | 7.88 per 1,000 |
| 142 | Strand | 7.87 per 1,000 |
| 143 | Eigersund | 7.86 per 1,000 |
| 144 | Stad | 7.86 per 1,000 |
| 145 | Vennesla | 7.85 per 1,000 |
| 146 | Giske | 7.82 per 1,000 |
| 147 | Kinn | 7.74 per 1,000 |
| 148 | Harstad | 7.71 per 1,000 |
| 149 | Stord | 7.70 per 1,000 |
| 150 | Vadsø | 7.69 per 1,000 |
Not ranked because the municipality has fewer than 5,000 inhabitants, where a few people can move the figure a lot (174): Alvdal (8.02 per 1,000), Andøy (6.77 per 1,000), Aremark (9.03 per 1,000), Askvoll (11.87 per 1,000), Aukra (7.66 per 1,000), Aure (9.76 per 1,000), Aurland (14.65 per 1,000), Austrheim (11.90 per 1,000), Bardu (5.06 per 1,000), Beiarn (7.79 per 1,000), Berlevåg (7.71 per 1,000), Bindal (7.19 per 1,000), Bjerkreim (7.72 per 1,000), Bokn (14.98 per 1,000), Bremanger (5.74 per 1,000), Bygland (16.73 per 1,000), Bykle (13.07 per 1,000), Båtsfjord (7.56 per 1,000), Bø (5.80 per 1,000), Dovre (9.33 per 1,000), Drangedal (9.29 per 1,000), Dyrøy (9.47 per 1,000), Dønna (7.19 per 1,000), Eidfjord (19.75 per 1,000), Engerdal (5.27 per 1,000), Etne (10.07 per 1,000), Etnedal (8.07 per 1,000), Evenes (11.45 per 1,000), Evje og Hornnes (8.97 per 1,000), Fedje (25.34 per 1,000), Fitjar (10.06 per 1,000), Fjaler (10.30 per 1,000), Fjord (8.82 per 1,000), Flakstad (13.11 per 1,000), Flatanger (6.32 per 1,000), Flesberg (8.04 per 1,000), Flå (30.99 per 1,000), Folldal (4.61 per 1,000), Frosta (13.23 per 1,000), Fyresdal (15.52 per 1,000) …
Not available for 2 municipalities (hidden by the source, too small or not measured): Haram, Ålesund