Municipalities creating the most value
Value created by the limited companies we follow, by business address, per inhabitant.
Frøya has the highest value creation per inhabitant of Norway's municipalities at 1,642,970 kr (2025). The lowest is Leka at 12,501 kr. Source: Brønnøysundregistrene (Regnskapsregisteret), processed by Morning Analytics 2 November 2026.
Download the table (CSV) Sharing image (PNG)
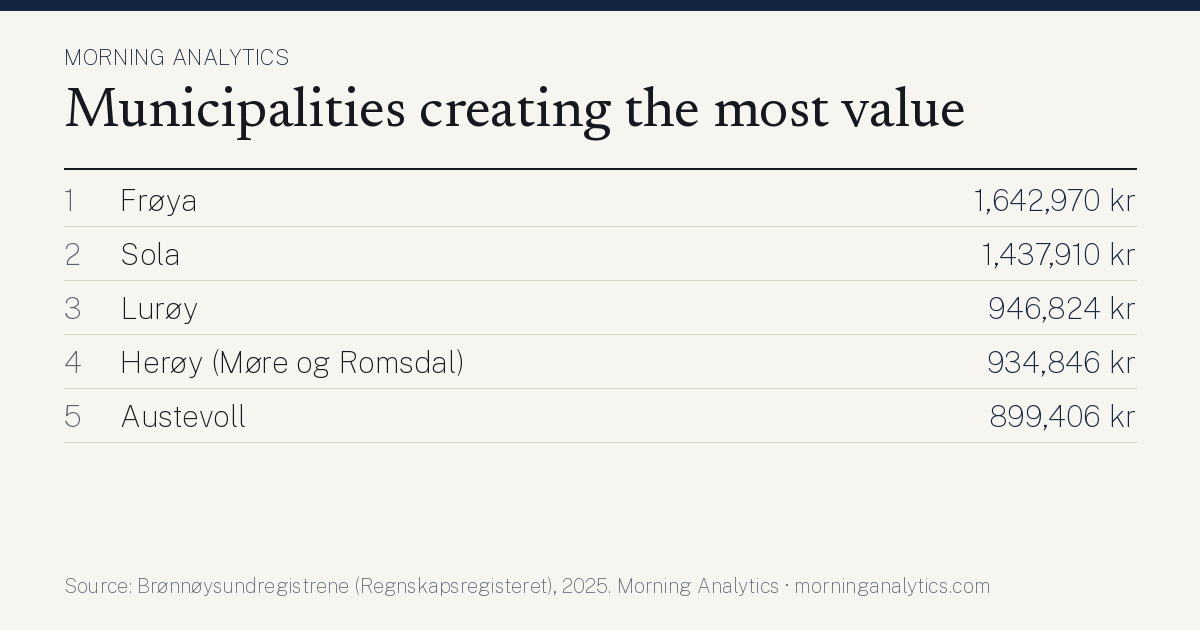
Based on 112,428 limited companies with accounts for 2025. 33,557 companies without payroll costs and 36 without an exchange rate are left out.
The picture in figures
The bars show the ten highest and the ten lowest of 357 municipalities. The dashed line is the median of all municipalities.
Each bar is the number of municipalities in a range of values. The dashed line is the median. Hover over a bar to see the range.
Analysis: why are some at the top and others at the bottom?
We compared value creation per inhabitant with every other municipal figure we have, from Statistics Norway, NIPH and the Brønnøysund Register Centre. Below are the figures that go most closely together with value creation per inhabitant across the country, and what marks the municipalities at the top and bottom on those figures.
The pattern across the country
- Municipalities that rank high on «Job coverage (jobs per employed resident)» most often also rank high on value creation per inhabitant (moderate association, rank correlation 0.50 across 357 municipalities; Statistics Norway table 11618).
- Municipalities that rank high on «Net in-commuting, share of employed residents» most often also rank high on value creation per inhabitant (moderate association, rank correlation 0.49 across 357 municipalities; Statistics Norway table 11616).
- Municipalities that rank high on «Gross income per person aged 17 and over, mean» most often also rank high on value creation per inhabitant (moderate association, rank correlation 0.43 across 357 municipalities; Statistics Norway table 03068).
- Municipalities that rank high on «Limited companies we follow per 1,000 inhabitants» most often also rank high on value creation per inhabitant (moderate association, rank correlation 0.32 across 347 municipalities; Brønnøysund Register Centre, our own calculations).
The highest and the lowest
- No. 1 Frøya (1,642,970 kr) Fits the pattern: «Job coverage (jobs per employed resident)» 129.8% (no. 3 of 357 from the top; Statistics Norway table 11618); «Net in-commuting, share of employed residents» 29.5% (no. 3 of 357 from the top; Statistics Norway table 11616); «Gross income per person aged 17 and over, mean» 720,300 kr (no. 7 of 357 from the top; Statistics Norway table 03068). Most distinctive industry: fiske, fangst og akvakultur, 22% of the jobs, 26.9 times the national share (Statistics Norway table 13470, 2025).
- No. 2 Sola (1,437,910 kr) Fits the pattern: «Job coverage (jobs per employed resident)» 184.8% (no. 1 of 357 from the top; Statistics Norway table 11618); «Net in-commuting, share of employed residents» 79.8% (no. 1 of 357 from the top; Statistics Norway table 11616); «Gross income per person aged 17 and over, mean» 747,400 kr (no. 4 of 357 from the top; Statistics Norway table 03068). Most distinctive industry: tjenester tilknyttet bergverksdrift og utvinning, 33% of the jobs, 26.4 times the national share (Statistics Norway table 13470, 2025).
- No. 3 Lurøy (946,824 kr) Fits the pattern: «Gross income per person aged 17 and over, mean» 876,100 kr (no. 1 of 357 from the top; Statistics Norway table 03068); «Job coverage (jobs per employed resident)» 117.3% (no. 11 of 357 from the top; Statistics Norway table 11618); «Net in-commuting, share of employed residents» 15.0% (no. 15 of 357 from the top; Statistics Norway table 11616). Most distinctive industry: fiske, fangst og akvakultur, 28% of the jobs, 35.1 times the national share (Statistics Norway table 13470, 2025).
- No. 357 Leka (12,501 kr, among the lowest) Fits the pattern: «Limited companies we follow per 1,000 inhabitants» 33.56 per 1,000 (no. 343 of 347 from the top; Brønnøysund Register Centre, our own calculations). Most distinctive industry: sjøfart, 11% of the jobs, 18.0 times the national share (Statistics Norway table 13470, 2025).
- No. 356 Aremark (12,943 kr, among the lowest) Fits the pattern: «Job coverage (jobs per employed resident)» 49.8% (no. 346 of 357 from the top; Statistics Norway table 11618); «Net in-commuting, share of employed residents» −48.0% (no. 343 of 357 from the top; Statistics Norway table 11616); «Limited companies we follow per 1,000 inhabitants» 49.48 per 1,000 (no. 268 of 347 from the top; Brønnøysund Register Centre, our own calculations). Most distinctive industry: skogbruk og tjenester tilknyttet skogbruk, 7% of the jobs, 29.9 times the national share (Statistics Norway table 13470, 2025).
- No. 355 Fedje (17,146 kr, among the lowest) The municipality does not stand out on the figures that otherwise go together with the measure. The explanation probably lies in something we have no figures for. Most distinctive industry: sjøfart, 6% of the jobs, 10.3 times the national share (Statistics Norway table 13470, 2025).
The analysis describes what goes together, not what causes what. Two figures can follow each other because both depend on something else, such as size, location or industry. The figures are from the latest year available for each source, so the years can differ. Rank correlation runs from −1 to 1; values near 1 mean the municipalities lie in roughly the same order on both measures.
What explains the placing?
- 1. Frøya 1,642,970 kr Nothing in particular to note.
- 2. Sola 1,437,910 kr Nothing in particular to note.
- 3. Lurøy 946,824 kr Small municipality (1,953 inhabitants): one company or a few people can move the figure a lot.
- 355. Fedje 17,146 kr Small municipality (529 inhabitants): one company or a few people can move the figure a lot. Samnøy Maskin AS alone accounts for 58% of the value creation in the municipality.
- 356. Aremark 12,943 kr Small municipality (1,354 inhabitants): one company or a few people can move the figure a lot.
- 357. Leka 12,501 kr Small municipality (596 inhabitants): one company or a few people can move the figure a lot.
| # | Municipality | value creation per inhabitant |
|---|---|---|
| 201 | Kragerø | 106,947 kr |
| 202 | Froland | 106,930 kr |
| 203 | Luster | 106,310 kr |
| 204 | Sunndal | 106,207 kr |
| 205 | Sigdalsmall municipality | 105,848 kr |
| 206 | Ringebusmall municipality | 105,668 kr |
| 207 | Gjesdal | 105,659 kr |
| 208 | Vadsø | 105,257 kr |
| 209 | Kviteseidsmall municipality | 105,128 kr |
| 210 | Nord-Odalsmall municipality · one company dominates | 103,803 kr |
| 211 | Fauske | 103,795 kr |
| 212 | Oppdal | 103,115 kr |
| 213 | Hasviksmall municipality | 103,074 kr |
| 214 | Midtre Gauldal | 102,868 kr |
| 215 | Storfjordsmall municipality | 102,736 kr |
| 216 | Fyresdalsmall municipality | 102,156 kr |
| 217 | Øyer | 101,910 kr |
| 218 | Hemsedalsmall municipality | 101,549 kr |
| 219 | Nordreisasmall municipality | 100,113 kr |
| 220 | Namsos | 98,919 kr |
| 221 | Inderøy | 98,387 kr |
| 222 | Lærdalsmall municipality | 98,180 kr |
| 223 | Vangsmall municipality | 96,600 kr |
| 224 | Harstad | 96,087 kr |
| 225 | Volda | 95,821 kr |
| 226 | Sunnfjord | 95,334 kr |
| 227 | Rakkestad | 94,728 kr |
| 228 | Hurdalsmall municipality · one company dominates | 93,265 kr |
| 229 | Hustadvika | 93,265 kr |
| 230 | Lebesbysmall municipality | 92,995 kr |
| 231 | Tynset | 92,596 kr |
| 232 | Meløy | 92,383 kr |
| 233 | Vardøsmall municipality | 91,855 kr |
| 234 | Gamviksmall municipality | 91,263 kr |
| 235 | Alstahaug | 89,500 kr |
| 236 | Eidskog | 89,244 kr |
| 237 | Midt-Telemark | 88,884 kr |
| 238 | Saltdalsmall municipality | 88,770 kr |
| 239 | Bjerkreimsmall municipality | 88,703 kr |
| 240 | Auresmall municipality | 88,646 kr |
| 241 | Skjåksmall municipality | 88,331 kr |
| 242 | Tjeldsundsmall municipality | 88,254 kr |
| 243 | Verdal | 88,002 kr |
| 244 | Flåsmall municipality | 87,936 kr |
| 245 | Hole | 86,180 kr |
| 246 | Åmlismall municipality | 85,348 kr |
| 247 | Tolgasmall municipality | 84,523 kr |
| 248 | Hjartdalsmall municipality | 83,345 kr |
| 249 | Indre Østfold | 83,128 kr |
| 250 | Vinjesmall municipality | 82,710 kr |