Informasjon og kommunikasjon
FollowDownload sector report (PDF)2,212 companies ranked against comparable companies in four Morning company classes. Fiscal year 2025. Source: Brønnøysund Register Centre. Methodology
Ranking · 2025 · Morning class Micro
The rank is the rank in the class. A class with fewer than ten companies is compared with the whole sector. Full ranking · Press mode
Biggest moves · Morning class Micro
- Eatops AS+63
From 2024 to 2025: the operating margin rose from −46.1% to 34.9% and the equity ratio rose from −94.4% to 43.1%.
- Adalia AS+57
From 2024 to 2025: the equity ratio rose from −125.7% to 58.2% and the operating margin rose from −6.4% to 22.5%.
- Gutta Sprut AS+53
From 2024 to 2025: the operating margin rose from −51.2% to 33.1% and the equity ratio rose from −84.9% to 9.4%.
- Raincode AS−48
From 2024 to 2025: the operating margin fell from 8.5% to −35.0% and the equity ratio fell from 89.1% to 16.4%.
Informasjon og kommunikasjon, Morning class Large: 132 ranked companies in fiscal year 2025.
Best in the sector: Novorender AS (score 88, operating margin 78.0%, equity ratio 74.4%). Eviny Fiber AS (score 80, operating margin 39.9%, equity ratio 71.3%). Zenitel Norway AS (score 79, operating margin 26.3%, equity ratio 49.8%).
Weakest in the sector: Volue Technology AS (score 11, operating margin −2.6%, equity ratio 8.3%). Vivicta AS (score 11, operating margin −8.0%, equity ratio 0.6%). Cognite AS (score 14, operating margin −30.6%, equity ratio −17.5%).
Worth a closer look
- The median operating margin rose from 6.1% in 2024 to 6.9% in 2025 (0.9 percentage points).
- The median equity ratio rose from 26.4% in 2024 to 28.2% in 2025 (1.8 percentage points).
- The median revenue growth fell from 8.9% in 2024 to 7.5% in 2025 (1.4 percentage points).
- The share with a loss went from 21% in 2024 to 20% in 2025.
Written by fixed rules from the figures. Describes the figures, does not explain causes. Not investment or financial advice. How the summary is made
Top lists in the sector · 2025 · Morning class Micro
The five largest companies account for 1% of the sector's revenue. Combined profit before tax for the 1,078 ranked companies: −283 MNOK.
Size
The largest by revenue and employees, and who earns the most per employee.
Highest revenue
- Layer Gruppen AS 10 MNOK
- Akersposten Media AS 10 MNOK
- Bros Interactive AS 10 MNOK
- Robotic Innovation AS 10 MNOK
- Baymarkets AS 10 MNOK
Operating revenue.
Most employees
- Aidn AS 140
- Always Connecting AS 93
- Deepinsight AS 46
- Muybridge AS 33
- Maritime Optima AS 32
Employees according to the Central Coordinating Register.
Highest revenue per employee
- Bros Interactive AS 2.0 MNOK
- Novitas Consulting AS 1.9 MNOK
- UR Solutions AS 1.8 MNOK
- Short Shift AS 1.8 MNOK
- Skiwo AS 1.8 MNOK
Only companies with at least 5 employees.
Profit and balance
Who earns the most, who loses the most, and who has the strongest balance sheet.
Highest operating margin
- Digital Safety AS 149.5%
- Alphaville Productions AS 99.6%
- Dotcom AS 99.2%
- Saas AS 98.7%
- Flus AS 98.7%
Operating result divided by operating revenue.
Largest profit
- Omega AS 118 MNOK
- Symfoni Software AS 72 MNOK
- Set Group AS 26 MNOK
- Bondata AS 20 MNOK
- Bifrost og Draupne AS 17 MNOK
Profit before tax.
Largest loss
- Teleplan Holding AS −122 MNOK
- Hawk Infinity AS −108 MNOK
- Huddlestock Fintech AS −87 MNOK
- Aidn AS −62 MNOK
- Wakandi Group AS −54 MNOK
Profit before tax, the largest negative.
Most solid
- Kbb Medic AS 100.0%
- Flus AS 100.0%
- Cas 1 AS 99.9%
- Vibbio AS 99.9%
- CAPABLE.Healthcare AS 99.8%
Equity ratio: equity divided by total assets.
Growth and movement
Who grows and falls the most in revenue, and who has climbed or fallen the most on the index since the year before.
Fastest growth
No company meets the requirement this year.
Revenue growth from the year before, only from at least NOK 10 million in revenue.
Largest revenue decline
- Fantefilm Produksjon AS −95.2%
- Level Holding AS −90.8%
- Intutor Group AS −86.1%
- Shuuto Arctic AS −84.0%
- Omega AS −79.0%
Revenue decline from the year before, only from at least NOK 10 million in revenue.
Biggest climbers
- Eatops AS +63.6 points
- Adalia AS +57.4 points
- Gutta Sprut AS +53.0 points
- Smau Media AS +47.9 points
- Humin AS +44.7 points
Change in index points from the year before.
Biggest fallers
- Raincode AS −48.2 points
- Push Media AS −47.6 points
- Toolboks AS −44.2 points
- Kompendium AS −41.5 points
- Global Tech Norway AS −41.0 points
Change in index points from the year before.
The lists cover ranked companies in the class: operating companies with at least NOK 1m in revenue, without holding companies and excluded ones. Size lists (revenue, profit, employees) count each group once. Source: Brønnøysund Register Centre. Amounts in other currencies are converted at Norges Bank's rates.
Positions in the sector · 2025 · Morning class Micro
Each company is placed by profitability and solidity, measured as a place from 0 to 100 against the others in the same sector and Morning company class. The bubble shows revenue. Hover over or tap a bubble for the figures, filter by profile or search for a company.
The chart and list show the 400 largest companies by revenue, of 1,083 in the class. Everyone is in the ranking. Full ranking
Bubble size shows relative revenue, not exact figures. Dashed lines show where the 5 companies that moved most stood in 2024 (small ring).
- Eatops AS profitability 6 → 90, solidity 0 → 49
- Gutta Sprut AS profitability 5 → 91, solidity 0 → 18
- Hygglo AS profitability 76 → 28, solidity 78 → 10
- Innskuddspensjonstjenester AS profitability 89 → 21, solidity 27 → 74
- Estimages Norge AS profitability 77 → 92, solidity 0 → 80
 Lion · LeaderHigh profitability, high solidity
 Cheetah · SprinterHigh profitability, lower solidity
 Elephant · StewardLower profitability, high solidity
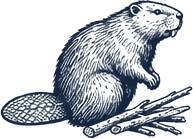 Beaver · BuilderLower profitability, lower solidity
Show the positions as a list
Summary · fiscal year 2025 · Morning class Micro
The sector's median operating margin is 5.7%. 619 of 2,568 companies have negative equity. The median equity ratio is 39.1%.
All figures are for fiscal year 2025. Ranked: 1,083 operating companies. Holding companies, excluded companies and companies without enough data are shown but not ranked. How to read the index
Climbers and fallers · Morning class Micro
Change in rank from 2024 to 2025, for 889 companies ranked in both years.
Climbers
- 906Eatops ASfrom rank 1,104 to 19868
- 900Adalia ASfrom rank 1,071 to 17170
- 822Smau Media ASfrom rank 1,010 to 18869
- 762Gutta Sprut ASfrom rank 1,102 to 34058
- 751Grinnemo Handel ASfrom rank 956 to 20568
Fallers
- 818Push Media ASfrom rank 132 to 95025
- 808Raincode ASfrom rank 193 to 1,00120
- 651Lindberg Development ASfrom rank 30 to 68143
- 635Hygglo ASfrom rank 318 to 95325
- 631Global Tech Norway ASfrom rank 404 to 1,03516
Awards · 2025 · Morning class Micro
Needs attention · 2025 · Morning class Micro
1,481 companies show at least one warning sign. Showing the 15 most important.
- criticalBaymarkets ASNegative equity · Current ratio below 1 (0.68) · Loss before tax
- criticalUnacast ASNegative equity · Current ratio below 1 (0.63) · Loss before tax
- criticalIRIS.AI ASNegative equity · Current ratio below 1 (0.39) · Loss before tax
- criticalHiro ASNegative equity · Current ratio below 1 (0.42) · Loss before tax
- criticalBli Synlig ASNegative equity · Current ratio below 1 (0.79) · Loss before tax
- criticalCollings Productions ASNegative equity · Current ratio below 1 (0.65) · Loss before tax
- criticalPSYKOLOGISK.NO ASNegative equity · Current ratio below 1 (0.70) · Loss before tax
- criticalInnofactor Holding ASNegative equity · Current ratio below 1 (0.93) · Loss before tax
- criticalSupervisuell ASNegative equity · Current ratio below 1 (0.90) · Loss before tax
- criticalBlix Data Center ASNegative equity · Current ratio below 1 (0.57) · Loss before tax
- criticalSoftgarden ASNegative equity · Current ratio below 1 (0.55) · Loss before tax
- criticalAltoros Norge ASNegative equity · Current ratio below 1 (0.96) · Loss before tax
- criticalOvervinne ASNegative equity · Current ratio below 1 (0.33) · Loss before tax
- criticalWrepit ASNegative equity · Current ratio below 1 (0.85) · Loss before tax
- criticalGlobal Office ASNegative equity · Current ratio below 1 (0.72) · Loss before tax
Sector map · 2025 · Morning class Micro
Profitability against solidity for the ranked companies. Size shows revenue. Coral triangle: negative equity. Click to open the company. Outliers are placed on the edge.
The map shows the 400 largest companies by revenue, of 1,082 ranked. Everyone is in the ranking.
Show the map's figures as a table
| Company | Operating margin | Equity ratio | Revenue |
|---|---|---|---|
| Layer Gruppen AS | 6.0% | −2.5% | 10 MNOK |
| Akersposten Media AS | 19.3% | 72.1% | 10 MNOK |
| Bros Interactive AS | 7.9% | 65.9% | 10 MNOK |
| Robotic Innovation AS | 16.6% | 10.6% | 10 MNOK |
| Baymarkets AS | −27.3% | −47.9% | 10 MNOK |
| Coherent AS | 4.4% | 45.4% | 10 MNOK |
| Nexer Asset Management AS | 11.3% | −339.6% | 10 MNOK |
| Unacast AS | −365.9% | −54.6% | 10 MNOK |
| Joymo AS | −178.3% | 72.9% | 10 MNOK |
| IRIS.AI AS | −217.0% | −120.2% | 10 MNOK |
| Fidl AS | −88.8% | 40.3% | 10 MNOK |
| Satvision Software AS | 3.6% | 76.0% | 10 MNOK |
| Scream Media AS | 7.3% | 33.6% | 10 MNOK |
| Gentoo Norway AS | 18.6% | 58.3% | 10 MNOK |
| Nordic Easy Norge AS | −3.3% | 14.2% | 10 MNOK |
| Crowd Professional Technologies AS | 1.6% | 12.7% | 10 MNOK |
| Motion Picture Licensing Company Norge AS | 11.8% | −14.5% | 10 MNOK |
| Maritime Optima AS | −242.1% | 26.3% | 9 MNOK |
| Hiro AS | −37.9% | −46.3% | 9 MNOK |
| Xsale AS | 2.6% | 7.5% | 9 MNOK |
| Nye Softcare AS | 67.0% | 61.8% | 9 MNOK |
| Motivati AS | −1.1% | 12.8% | 9 MNOK |
| Mind Consult AS | 4.5% | 36.8% | 9 MNOK |
| Kult Byrå AS | 4.9% | 32.5% | 9 MNOK |
| Novitas Consulting AS | −4.5% | −11.9% | 9 MNOK |
| Delta Media AS | −4.2% | 45.3% | 9 MNOK |
| Knif Media AS | −38.6% | 89.2% | 9 MNOK |
| 73 Eyes Film Production AS | 0.1% | −3.7% | 9 MNOK |
| Mobile First AS | 0.7% | 14.5% | 9 MNOK |
| Delante AS | 38.2% | 22.5% | 9 MNOK |
| Horecatec AS | 8.2% | 41.7% | 9 MNOK |
| Onetraffic Norway AS | 15.4% | 29.0% | 9 MNOK |
| Snowball Digital AS | 4.1% | −537.3% | 9 MNOK |
| UR Solutions AS | 6.9% | −22.5% | 9 MNOK |
| Short Shift AS | 24.6% | 86.8% | 9 MNOK |
| Cimple Technology AS | −22.6% | 9.1% | 9 MNOK |
| Skiwo AS | −187.5% | 80.8% | 9 MNOK |
| Luado AS | 6.9% | 32.8% | 9 MNOK |
| Jhl AS | 25.9% | 70.8% | 9 MNOK |
| Sensorita AS | −16.2% | 93.3% | 9 MNOK |
| Pengvin AS | 2.5% | 62.9% | 9 MNOK |
| Teleplan Holding AS | −158.9% | 91.6% | 9 MNOK |
| Diffia AS | −195.9% | −15.7% | 9 MNOK |
| Oclin AS | 12.2% | 26.7% | 9 MNOK |
| Bli Synlig AS | −3.1% | −13.9% | 9 MNOK |
| Kreatell Music AS | −26.4% | 47.5% | 9 MNOK |
| Lettlest Media AS | 10.5% | 22.7% | 9 MNOK |
| Level K6 AS | 2.1% | 41.3% | 9 MNOK |
| Safe 24-7 AS | 71.1% | 88.5% | 9 MNOK |
| Value Publishing AS | 0.0% | 12.7% | 9 MNOK |
| Styreportalen AS | 1.1% | 9.2% | 8 MNOK |
| Midt Norsk Avisdrift AS | −26.9% | 30.3% | 8 MNOK |
| Komplhex AS | 86.0% | 68.1% | 8 MNOK |
| Tenera AS | 32.5% | 22.6% | 8 MNOK |
| Selbyggen AS | −1.5% | 62.9% | 8 MNOK |
| Paleblue AS | 18.7% | 51.8% | 8 MNOK |
| Level Holding AS | 95.4% | 99.5% | 8 MNOK |
| Gutta Sprut AS | 33.1% | 9.4% | 8 MNOK |
| Moxey AS | −11.1% | 0.4% | 8 MNOK |
| Godata AS | 5.2% | 36.0% | 8 MNOK |
| Railcomplete AS | 24.7% | 61.4% | 8 MNOK |
| Noknok AS | 52.5% | 45.0% | 8 MNOK |
| Nors Care AS | −78.0% | 70.1% | 8 MNOK |
| Vestbris AS | 5.2% | 22.9% | 8 MNOK |
| Club United AS | −95.5% | 88.7% | 8 MNOK |
| Xvision Animation Studio AS | −16.2% | 43.3% | 8 MNOK |
| Nextcom Norge AS | 1.4% | 44.0% | 8 MNOK |
| Byndle AS | −18.9% | 8.1% | 8 MNOK |
| Iot Solutions AS | −123.8% | 39.5% | 8 MNOK |
| Boman AS | 42.2% | 28.3% | 8 MNOK |
| Wittario AS | −62.4% | 85.0% | 8 MNOK |
| Onwork AS | −17.3% | 29.4% | 8 MNOK |
| Antipode Films AS | 0.8% | −13.4% | 8 MNOK |
| Headshed AS | −7.5% | 64.8% | 8 MNOK |
| Muybridge AS | −587.2% | 71.4% | 8 MNOK |
| Red Thread Games AS | 20.6% | 12.9% | 8 MNOK |
| Rebel Unit AS | 1.5% | 29.2% | 8 MNOK |
| PSYKOLOGISK.NO AS | −11.1% | −66.3% | 8 MNOK |
| Cyberon Security AS | 4.0% | 48.4% | 8 MNOK |
| Insite Media AS | 22.2% | 45.0% | 8 MNOK |
| LL RYFYLKE | −2.6% | 70.5% | 8 MNOK |
| Innofactor Holding AS | 2.3% | −3.2% | 8 MNOK |
| New Productions AS | 11.1% | 83.5% | 8 MNOK |
| WP Hosting AS | −12.4% | 6.2% | 8 MNOK |
| Ansur Technologies AS | 36.5% | 58.0% | 8 MNOK |
| Kalenderforlaget AS | 1.5% | 72.2% | 8 MNOK |
| Foodback AS | −106.9% | 27.3% | 8 MNOK |
| Supervisuell AS | −2.5% | −27.0% | 8 MNOK |
| Blix Data Center AS | −9.3% | −1.8% | 8 MNOK |
| Softgarden AS | −0.9% | −81.3% | 8 MNOK |
| Karmøy Kino AS | −6.4% | 28.3% | 8 MNOK |
| Aceno Exx AS | 27.5% | 10.3% | 8 MNOK |
| Share Control AS | 21.4% | 29.1% | 8 MNOK |
| Leo Ajkic Ent AS | 77.9% | 92.0% | 8 MNOK |
| Hawk Infinity AS | −1,040.2% | 99.3% | 8 MNOK |
| Gigafib Bredbånd AS | −38.5% | 56.6% | 7 MNOK |
| Bladet Tysnes AS | −6.9% | 44.4% | 7 MNOK |
| Altoros Norge AS | −3.1% | −3.8% | 7 MNOK |
| Qbig AS | 18.9% | 63.7% | 7 MNOK |
| Figenschou Forlag AS | 32.2% | 74.9% | 7 MNOK |
| Matoma Productions AS | −59.6% | 74.6% | 7 MNOK |
| Graakammen Consulting AS | 19.4% | 84.2% | 7 MNOK |
| Fabillio AS | 9.2% | 11.8% | 7 MNOK |
| Moso AS | −0.4% | 65.8% | 7 MNOK |
| Ilaks AS | 29.3% | 28.3% | 7 MNOK |
| Viken Media AS | 1.9% | −22.9% | 7 MNOK |
| Clue Norge AS | 48.7% | 61.0% | 7 MNOK |
| Quinyx AS | 4.7% | 72.9% | 7 MNOK |
| Vilect AS | −19.8% | 21.3% | 7 MNOK |
| Overvinne AS | −59.0% | −29.5% | 7 MNOK |
| Trines Mat AS | 51.8% | 41.6% | 7 MNOK |
| Mediehuset Minerva AS | 0.6% | −0.7% | 7 MNOK |
| Outsourcia AS | −1.0% | 15.4% | 7 MNOK |
| Lucky View AS | 6.9% | 65.1% | 7 MNOK |
| Levitate AS | 4.9% | 23.3% | 7 MNOK |
| Axio Consulting AS | 8.1% | 4.4% | 7 MNOK |
| Aksel Jermstad AS | 22.2% | 72.2% | 7 MNOK |
| Innskuddspensjonstjenester AS | −10.7% | 71.1% | 7 MNOK |
| Fornix AS | −42.9% | 32.3% | 7 MNOK |
| Wrepit AS | −36.7% | −13.0% | 7 MNOK |
| Fabriq AS | 26.6% | 51.2% | 7 MNOK |
| Techep AS | −6.8% | −150.8% | 7 MNOK |
| Inova IT AS | 0.8% | 35.2% | 7 MNOK |
| UX Themes AS | 5.9% | 92.0% | 7 MNOK |
| Invite Guest Technology AS | −67.5% | 3.0% | 7 MNOK |
| Compelling AS | 73.6% | 91.8% | 7 MNOK |
| Servicetec Airport Operations Norway AS | −1.0% | 38.1% | 7 MNOK |
| Norsk Fakta Forlag AS | 40.2% | −230.4% | 7 MNOK |
| Norquant AS | −72.1% | 90.4% | 7 MNOK |
| LYK-Z & Døtre AS | 5.0% | −70.9% | 7 MNOK |
| Ideo Solutions AS | 6.5% | 70.7% | 7 MNOK |
| Helt Lokalt AS | 9.5% | 55.4% | 7 MNOK |
| Sørlandskjøkken Konsept AS | 7.9% | 36.4% | 7 MNOK |
| Copa Media AS | 2.1% | 15.7% | 7 MNOK |
| Spesialistbedriften AS | −13.2% | 39.2% | 7 MNOK |
| Global Office AS | −10.7% | −39.1% | 7 MNOK |
| Shuuto Arctic AS | 1.7% | −3.4% | 7 MNOK |
| Weisstech AS | 13.6% | 54.5% | 7 MNOK |
| Cezinando AS | 4.6% | 68.3% | 7 MNOK |
| Midtsiden AS | 1.8% | 21.1% | 7 MNOK |
| Bifrost og Draupne AS | −207.4% | 38.8% | 6 MNOK |
| Strengeleik AS | 45.0% | 66.6% | 6 MNOK |
| Lindberg Development AS | 4.1% | 14.2% | 6 MNOK |
| Sunnmøre Live AS | 3.5% | 3.8% | 6 MNOK |
| Kör Teknologi AS | −91.3% | −16.1% | 6 MNOK |
| Vestfold IT AS | 14.7% | 15.6% | 6 MNOK |
| Forzasys AS | −61.4% | 89.1% | 6 MNOK |
| IT Resource Group AS | 14.2% | 47.3% | 6 MNOK |
| Pkom AS | 7.0% | 44.3% | 6 MNOK |
| PIXELS & Bytes Solutions AS | 2.5% | 30.8% | 6 MNOK |
| Differ Media AS | 0.8% | 29.9% | 6 MNOK |
| Envision-IT AS | 17.9% | −21.6% | 6 MNOK |
| Twentyone Pictures AS | 0.1% | 2.9% | 6 MNOK |
| Edb-Konsulent AS | 87.5% | 54.7% | 6 MNOK |
| Energy Manager AS | −36.1% | 66.8% | 6 MNOK |
| N0r5ke Communication Services AS | −18.5% | −575.5% | 6 MNOK |
| Bitfarm AS | 0.0% | 8.3% | 6 MNOK |
| Bee612 AS | 88.0% | 98.1% | 6 MNOK |
| Lokotech Group AS | −271.3% | 98.7% | 6 MNOK |
| Projektorpøblene AS | 7.6% | 82.4% | 6 MNOK |
| Rscs Hydracloud AS | 42.6% | 70.9% | 6 MNOK |
| Technova AS | 12.8% | 28.0% | 6 MNOK |
| Visual360 AS | 11.3% | 14.1% | 6 MNOK |
| Kontigo Consulting AS | 50.4% | 3.4% | 6 MNOK |
| Digimentor AS | 2.5% | 63.1% | 6 MNOK |
| Facefirst AS | 4.4% | 58.9% | 6 MNOK |
| Visual Banking AS | 73.2% | 2.9% | 6 MNOK |
| Alvdal Midt i Væla AS | 4.4% | −10.8% | 6 MNOK |
| Appresso AS | 2.6% | 65.9% | 6 MNOK |
| Hanne Krogh Productions AS | 5.1% | 87.2% | 6 MNOK |
| I-Drift AS | −1.8% | 79.6% | 6 MNOK |
| Inbovi AS | −0.9% | 24.9% | 6 MNOK |
| Layer One AS | 7.3% | 17.3% | 6 MNOK |
| The Independent Barentsobserver AS | 10.8% | 67.1% | 6 MNOK |
| Visuell Natur AS | −0.1% | 22.0% | 6 MNOK |
| Accenture Services AS | 6.6% | 71.4% | 6 MNOK |
| Jansen Plateproduksjon AS | 3.4% | 3.2% | 6 MNOK |
| Northgrc AS | −0.7% | 5.4% | 6 MNOK |
| Ocean Access AS | 11.5% | 39.4% | 6 MNOK |
| Stover Consulting AS | −1.6% | 11.4% | 6 MNOK |
| Catchwise AS | −7.2% | 98.5% | 6 MNOK |
| Mikan Media AS | 40.5% | 40.3% | 6 MNOK |
| Artsys Solutions AS | 31.2% | 2.4% | 6 MNOK |
| Hygglo AS | −0.6% | 2.1% | 6 MNOK |
| Infotiles AS | −59.2% | 52.2% | 6 MNOK |
| Elastisk AS | −8.8% | 24.5% | 6 MNOK |
| Dipai AS | −16.6% | 84.4% | 6 MNOK |
| Sulaposten AS | −1.6% | 61.4% | 6 MNOK |
| Kunstavisen AS | −0.1% | 58.4% | 6 MNOK |
| Wohali AS | 9.4% | 73.0% | 6 MNOK |
| World of Walker Publishing AS | 40.7% | 0.6% | 6 MNOK |
| Hesbynett AS | −21.7% | −75.7% | 6 MNOK |
| Everyday AS | 24.7% | 75.6% | 6 MNOK |
| Mojob Norge AS | −55.9% | 1.7% | 6 MNOK |
| Theta Development AS | 56.1% | 21.6% | 6 MNOK |
| Kredin AS | −43.0% | 58.9% | 6 MNOK |
| Lily AS | 13.8% | 4.9% | 6 MNOK |
| Learn Handball AS | −10.9% | 33.3% | 6 MNOK |
| Indie Film Bergen AS | 5.4% | 29.1% | 6 MNOK |
| Ulv Ulv AS | 76.4% | 72.6% | 6 MNOK |
| Dyktig AS | 46.9% | 9.6% | 6 MNOK |
| Epico AS | −5.8% | 76.7% | 6 MNOK |
| Museumsforlaget AS | −5.2% | 72.6% | 5 MNOK |
| Ipsum AS | 2.9% | 9.0% | 5 MNOK |
| Driven BY Analytics AS | 46.1% | 83.3% | 5 MNOK |
| OPTIMAIZAI.Com AS | 7.4% | 29.9% | 5 MNOK |
| Clarify AS | 17.3% | 25.5% | 5 MNOK |
| Neurosys AS | 6.6% | 58.8% | 5 MNOK |
| Fourc AS | −14.9% | 44.1% | 5 MNOK |
| Guilty AS | −10.5% | −8.9% | 5 MNOK |
| Kodeklang AS | 48.9% | 6.0% | 5 MNOK |
| AS VESTERÅLENS AVIS | 0.7% | 47.7% | 5 MNOK |
| Flexon AS | 55.5% | 71.5% | 5 MNOK |
| Dotcom AS | 99.2% | 16.7% | 5 MNOK |
| Novus AS | 19.3% | 71.5% | 5 MNOK |
| Augmentcity AS | −84.2% | 8.9% | 5 MNOK |
| Nordic Data Resources AS | 19.5% | 3.9% | 5 MNOK |
| Ablecon AS | 1.6% | 10.8% | 5 MNOK |
| Eatops AS | 34.9% | 43.1% | 5 MNOK |
| Rippling Norway AS | 0.2% | 3.5% | 5 MNOK |
| Vest Sanering AS | 5.6% | 4.0% | 5 MNOK |
| Prosjektrelasjoner AS | 1.1% | 15.0% | 5 MNOK |
| Mellora AS | −8.8% | 59.7% | 5 MNOK |
| Nard AS | 14.0% | 69.0% | 5 MNOK |
| Motion Air AS | −9.4% | 27.6% | 5 MNOK |
| Flammekaster AS | 3.8% | 55.2% | 5 MNOK |
| Tycho Space Technologies AS | 4.9% | 15.3% | 5 MNOK |
| Deriveme AS | −3.5% | 67.3% | 5 MNOK |
| Accelat AS | −17.7% | −54.6% | 5 MNOK |
| Nodex Data AS | 6.6% | 77.8% | 5 MNOK |
| Smau Media AS | 16.4% | 57.9% | 5 MNOK |
| Always Connecting AS | 10.6% | −71.4% | 5 MNOK |
| Hagle AS | 16.8% | 1.6% | 5 MNOK |
| Literate AS | −39.6% | 33.5% | 5 MNOK |
| Nextplay AS | 44.2% | 42.5% | 5 MNOK |
| Bladet Evangelisten AS | 13.7% | 43.4% | 5 MNOK |
| Hemy AS | −400.7% | −6.6% | 5 MNOK |
| Withsecure Norge AS | 3.8% | −46.1% | 5 MNOK |
| Technet Consulting AS | 37.7% | 61.3% | 5 MNOK |
| Laudi AS | 36.2% | 89.9% | 5 MNOK |
| Nordic Building Modelling Norway AS | 6.8% | 15.2% | 5 MNOK |
| Turbulent Flux AS | −215.8% | 80.7% | 5 MNOK |
| Datadrivenfinance AS | −608.5% | −234.7% | 5 MNOK |
| Øyposten AS | 16.8% | 51.9% | 5 MNOK |
| Munck Studios AS | 10.5% | −51.3% | 5 MNOK |
| Omega AS | −194.2% | 28.6% | 5 MNOK |
| Exstructa AS | 36.4% | 92.3% | 5 MNOK |
| Lyngdals Avis AS | −22.0% | 20.9% | 5 MNOK |
| Cycled Technologies AS | 3.2% | 59.4% | 5 MNOK |
| Din IT Partner AS | 27.0% | 21.7% | 5 MNOK |
| Garnes Gruppen AS | −11.0% | 13.1% | 5 MNOK |
| Webtron AS | 20.5% | 23.6% | 5 MNOK |
| Skipr AS | −1.6% | 15.6% | 5 MNOK |
| Global Tech Norway AS | −17.5% | −4.1% | 5 MNOK |
| Leirskoledagboken AS | 10.6% | 30.5% | 5 MNOK |
| Soniro AS | 5.5% | 7.1% | 5 MNOK |
| The Hub AS | 12.8% | −118.7% | 5 MNOK |
| Moo Gruppen AS | −16.5% | −15.6% | 5 MNOK |
| Gobi Stories AS | −1.4% | 60.2% | 5 MNOK |
| Driftsikker Kommunikasjon AS | 21.6% | −5.6% | 5 MNOK |
| Nettverksspesialisten AS | 3.1% | 42.6% | 5 MNOK |
| Tind Software AS | 14.1% | 65.3% | 5 MNOK |
| Evorium AS | 46.1% | 64.0% | 5 MNOK |
| Accurize AS | −12.6% | −134.8% | 5 MNOK |
| Vestfjorden Media AS | −2.0% | 54.6% | 5 MNOK |
| Estimages Norge AS | 38.6% | 77.7% | 5 MNOK |
| Scarp AS | 4.8% | 15.1% | 5 MNOK |
| Multifiber AS | 4.7% | 22.5% | 5 MNOK |
| Airport Innovation AS | 22.1% | 19.8% | 5 MNOK |
| Bypatrioten AS | 8.1% | 60.7% | 5 MNOK |
| Biogenic Norge AS | −1.3% | 19.6% | 5 MNOK |
| Rain AS | −2.1% | −381.2% | 5 MNOK |
| Viascan AS | 25.3% | 67.1% | 5 MNOK |
| Migris AS | 0.7% | 60.1% | 5 MNOK |
| Alfredfilm AS | −1.8% | 23.7% | 5 MNOK |
| Wau I/O AS | −2.6% | 48.5% | 5 MNOK |
| Apiteq AS | −2.8% | −139.8% | 5 MNOK |
| Stray Dog Productions AS | 1.0% | 7.0% | 5 MNOK |
| Trans-IT Norge AS | −4.8% | 43.9% | 5 MNOK |
| Tungsten Automation Norway AS | 14.1% | 28.7% | 5 MNOK |
| Znapio AS | 12.1% | 77.8% | 5 MNOK |
| Unified Analytics AS | −4.7% | 48.3% | 5 MNOK |
| Aiqos Norway AS | 7.5% | 33.8% | 5 MNOK |
| Finansmodell 1 AS | 4.9% | 83.2% | 4 MNOK |
| Ambrosius AS | −14.3% | 51.8% | 4 MNOK |
| Mementoit AS | 30.5% | 19.1% | 4 MNOK |
| COMPLETE - Pos AS | 1.8% | 37.1% | 4 MNOK |
| Omnicus AS | 6.0% | −100.6% | 4 MNOK |
| Kystvind AS | −12.8% | 14.2% | 4 MNOK |
| Hyttetjenester AS | −176.0% | 87.3% | 4 MNOK |
| Oyatel AS | 2.0% | 37.9% | 4 MNOK |
| Imaker AS | 30.4% | 18.2% | 4 MNOK |
| Emix AS | −0.9% | 65.6% | 4 MNOK |
| Appletify AS | 11.5% | 6.3% | 4 MNOK |
| Ecom AS | −4.5% | 5.9% | 4 MNOK |
| TE Terjesen Consulting AS | 4.8% | 35.2% | 4 MNOK |
| Tsg Group AS | −14.2% | 88.2% | 4 MNOK |
| Subcenture AS | 29.1% | 10.9% | 4 MNOK |
| Digimaker AS | −14.2% | 38.7% | 4 MNOK |
| FRØYA.NO AS | 7.8% | 47.1% | 4 MNOK |
| Pocket ID AS | 24.7% | 23.0% | 4 MNOK |
| Smidig IT AS | 4.1% | 19.9% | 4 MNOK |
| Living Daylights Productions AS | −10.3% | 53.8% | 4 MNOK |
| Paranord Film AS | 0.2% | 0.0% | 4 MNOK |
| Memo Forlag AS | 2.1% | 5.8% | 4 MNOK |
| Magnisent AS | 45.8% | 20.4% | 4 MNOK |
| Ungt Medborgerskap AS | −0.1% | 4.3% | 4 MNOK |
| Kryptosekken AS | 32.5% | 93.3% | 4 MNOK |
| Acadu AS | −51.5% | −45.8% | 4 MNOK |
| Cateno AS | 11.5% | 35.8% | 4 MNOK |
| Smalltown Supersound AS | 10.5% | 13.6% | 4 MNOK |
| Easynetbooking AS | 24.8% | 17.2% | 4 MNOK |
| Ubåt AS | 9.8% | 42.0% | 4 MNOK |
| Createview AS | −108.5% | 35.3% | 4 MNOK |
| Bakkar og Berg Media AS | −16.3% | 68.8% | 4 MNOK |
| Webcraft AS | 8.9% | 34.7% | 4 MNOK |
| Øra Studio AS | 1.6% | 4.9% | 4 MNOK |
| Vibbio AS | 97.2% | 99.9% | 4 MNOK |
| NORTHSTAR - Impact Analytics AS | 14.1% | −16.0% | 4 MNOK |
| Human Rights Human Wrongs AS | −3.1% | 77.3% | 4 MNOK |
| Apollon Records AS | 3.1% | 40.5% | 4 MNOK |
| 5Arns Data AS | −3.0% | −24.9% | 4 MNOK |
| Vestfjorden Consulting AS | 11.3% | 31.6% | 4 MNOK |
| Skolevisjoner AS | 9.0% | 23.2% | 4 MNOK |
| Mega Therion AS | 11.1% | −35.2% | 4 MNOK |
| Luca Labs AS | −7.3% | 11.7% | 4 MNOK |
| Awesome Technologies AS | 32.2% | 3.3% | 4 MNOK |
| Monteraponi AS | 84.1% | 85.0% | 4 MNOK |
| Hera Lab AS | 61.9% | 98.3% | 4 MNOK |
| Øy-Blikk AS | 3.3% | 1.7% | 4 MNOK |
| Fabrikamm AS | −283.6% | −668.6% | 4 MNOK |
| Handmade Films in Norwegian Woods AS | 1.8% | −23.2% | 4 MNOK |
| Ixmal Intelesis AS | −4.1% | 70.4% | 4 MNOK |
| Bimbear AS | 11.4% | 28.5% | 4 MNOK |
| Alphaville Productions AS | 99.6% | −73.8% | 4 MNOK |
| RF Nett AS | 27.3% | 43.1% | 4 MNOK |
| Gmb AS | 2.4% | −6.3% | 4 MNOK |
| Direkte Kompetanse AS | 55.3% | 1.5% | 4 MNOK |
| Geir Jovik AS | 45.8% | 3.0% | 4 MNOK |
| Musicbox AS | 15.7% | 6.5% | 4 MNOK |
| Edlib AS | −20.8% | 22.1% | 4 MNOK |
| Agder Chiptuning AS | 28.8% | 38.3% | 4 MNOK |
| Thomas Eriksen Music AS | 22.7% | −2.0% | 4 MNOK |
| Milla Says AS | 12.9% | 83.4% | 4 MNOK |
| Race Tracker AS | 10.8% | 27.9% | 4 MNOK |
| Intime Nordic AS | 2.3% | 63.7% | 4 MNOK |
| Industrial Automation Nordic AS | 11.9% | 45.2% | 4 MNOK |
| Chartdawn AS | 33.0% | −51.9% | 4 MNOK |
| SAPIENS SOFTWARE SOLUTIONS (NORWAY) AS | 5.2% | 49.9% | 4 MNOK |
| Qoblex AS | 3.9% | 82.9% | 4 MNOK |
| Fram X AS | 3.3% | 23.2% | 4 MNOK |
| Software Control AS | 5.8% | 9.8% | 4 MNOK |
| Plus AS | 20.5% | −524.0% | 4 MNOK |
| CAPABLE.Healthcare AS | −1.0% | 99.8% | 4 MNOK |
| It's Gonna Happen AS | 10.1% | 46.3% | 4 MNOK |
| Captio AS | −9.8% | −353.7% | 4 MNOK |
| Lemuur AS | −12.5% | 41.4% | 4 MNOK |
| Alpha Software AS | 41.1% | 58.8% | 4 MNOK |
| Companycasts AS | 10.4% | 40.6% | 4 MNOK |
| Roar Film AS | 51.1% | 56.1% | 4 MNOK |
| Vardahei IT AS | 3.4% | 65.3% | 4 MNOK |
| Kreatell Publishing AS | −0.9% | −7.3% | 4 MNOK |
| Pikselsmia AS | 3.4% | 49.9% | 4 MNOK |
| Pagelook AS | 15.1% | 55.9% | 4 MNOK |
| Next Level AS | 14.9% | −5.5% | 4 MNOK |
| Ten Thousand Images AS | −13.6% | −111.7% | 4 MNOK |
| Harvest Publishing AS | 1.8% | 70.2% | 4 MNOK |
| Ixcelio AS | 26.8% | 48.5% | 4 MNOK |
| Nerd Nomads AS | 32.4% | 71.1% | 4 MNOK |
| Smartplan AS | −8.8% | 29.6% | 4 MNOK |
| Nsn AS | 17.0% | 41.2% | 4 MNOK |
| Bonefish AS | 7.3% | 47.6% | 4 MNOK |
| Sqlexpert AS | 12.9% | 23.2% | 4 MNOK |
| Storespeed AS | −40.9% | 12.8% | 4 MNOK |
| DO IT Solutions AS | 3.0% | 35.9% | 4 MNOK |
| Scandinavian House AS | 44.8% | 25.6% | 4 MNOK |
| Afini AS | 24.7% | 87.3% | 4 MNOK |
| Lineo AS | −1.4% | 51.8% | 4 MNOK |
| PIXELS & Bytes AS | 2.6% | 25.3% | 4 MNOK |
| Kavar AS | 38.3% | 72.0% | 4 MNOK |
| Shoplabs AS | −2.4% | −41.6% | 4 MNOK |
| Masse Media AS | −0.9% | −9.4% | 4 MNOK |
| Prosa Security AS | −2.3% | 16.3% | 4 MNOK |
| Intellitech AS | −103.6% | 90.4% | 4 MNOK |
| Abel Technologies AS | −1,320.5% | 50.2% | 3 MNOK |
| Øian Technology AS | 66.5% | 84.3% | 3 MNOK |
| Hacienda Film AS | −16.8% | 24.5% | 3 MNOK |
| Erte Media AS | 0.6% | 58.5% | 3 MNOK |
| Klæbuposten AS | −22.5% | 69.4% | 3 MNOK |
| Aidn AS | −1,563.3% | 87.7% | 3 MNOK |
| Ctelo AS | 0.5% | 16.8% | 3 MNOK |
| Anzyz Technologies AS | −63.3% | 92.1% | 3 MNOK |
| Raskenlund AS | 4.1% | 58.2% | 3 MNOK |
| Drabant Music AS | −4.7% | −155.2% | 3 MNOK |
| Stærk Consulting AS | 65.5% | 54.1% | 3 MNOK |
| Bogstadveien Media AS | 11.7% | −94.9% | 3 MNOK |
| Future Then AS | 1.0% | 53.5% | 3 MNOK |
| Tom Odden AS | 18.3% | 98.0% | 3 MNOK |
| Buro Ops AS | −7.5% | 5.8% | 3 MNOK |
| Cuescore International AS | 2.2% | 51.2% | 3 MNOK |
Holding and investment companies · 2025
186 companies in the sector are holding or investment companies. They are kept out of the ranking above, since revenue, margins and growth say little about a company that lives from ownership. They are ranked on their own here: 61 have at least 10 MNOK in assets and are listed.
| Rank | Company | Score | Equity ratio | Return on assets | Current ratio | Total assets |
|---|---|---|---|---|---|---|
| 1 | Darwin Holding AS | 93 | 99.9% | 96.3% | 355.21 | 47 MNOK |
| 2 | Havarsa Holding AS | 88 | 99.7% | 93.1% | 368.71 | 34 MNOK |
| 3 | Auzilium Invest AS | 86 | 99.6% | 94.6% | 186.76 | 23 MNOK |
| 4 | Jepson Holding AS | 86 | 100.0% | 21.6% | 2,118.77 | 24 MNOK |
| 5 | Froma Holding AS | 78 | 99.4% | 87.8% | 106.78 | 14 MNOK |
| 6 | IC Invest AS | 77 | 100.0% | 14.1% | 7,216.56 | 24 MNOK |
| 7 | Castle Age Capital AS | 77 | 98.1% | 100.2% | 51.43 | 50 MNOK |
| 8 | Kanon Invest AS | 76 | 98.3% | 91.8% | 31.01 | 10 MNOK |
| 9 | Norse Holding AS | 74 | 100.0% | 18.3% | 8.22 | 180 MNOK |
| 10 | Sunday Invest AS | 74 | 98.9% | 43.2% | 57.61 | 19 MNOK |
| 11 | Dintero Holding AS | 71 | 99.9% | 11.4% | 789.43 | 77 MNOK |
| 12 | Opcode Invest AS | 70 | 99.6% | 14.9% | 167.75 | 13 MNOK |
| 13 | Dyar Holding AS | 69 | 98.3% | 16.9% | 443.90 | 572 MNOK |
| 14 | Bertheussen Invest AS | 68 | 98.9% | 17.7% | 89.49 | 655 MNOK |
| 15 | Ehaa Invest AS | 66 | 100.0% | 7.4% | – | 19 MNOK |
| 16 | Ingulstad Holding AS | 65 | 99.5% | 13.3% | 173.23 | 129 MNOK |
| 17 | Moroni Invest AS | 65 | 97.7% | 24.6% | 33.55 | 26 MNOK |
| 18 | Bakkejord Holding AS | 63 | 98.1% | 48.8% | 0.91 | 256 MNOK |
| 19 | Stonehaven Capital AS | 61 | 99.5% | 9.1% | 126.19 | 19 MNOK |
| 20 | Prontor Invest AS | 59 | 94.7% | 32.4% | 1.58 | 13 MNOK |
Show all 61
Score 0–100 against the other holding companies in the sector: equity ratio 40 %, return on assets 40 % and current ratio 20 %. Methodology
In our articles
- Finance earns 58.3% on operations; the typical Norwegian industry makes 5.7%No. 11 of 22 on median operating margin
Scenario analysis: the sector's weakest year
The sector's weakest year was 2026, with a median operating margin of 4.1%.
Based on the 8 fiscal years we have. The analysis grows as more years are fetched or imported.
| Fiscal year | Median operating margin | Median equity ratio |
|---|---|---|
| 2019 | – | – |
| 2020 | – | – |
| 2021 | – | – |
| 2022 | 6.1% | 28.2% |
| 2023 | 5.2% | 35.1% |
| 2024 | 5.2% | 33.6% |
| 2025 | 5.7% | 32.9% |
| 2026 · weakest year | 4.1% | 39.6% |
In 2026, 12 ranked companies did better than the sector, 9 about the same and 2 weaker.
Held up best in 2026
- 1H5p Group ASequity ratio 39.9%29.5%
- 2Accigo ASequity ratio 7.6%29.0%
- 3Sanity ASequity ratio 39.9%22.5%
- 4Ntt Data Business Solutions ASequity ratio 30.4%11.5%
- 5Dxc Technology Norge ASequity ratio 57.2%9.9%
- 6Neatframe ASequity ratio 48.7%9.7%
- 7Autodesk Norway Operations ASequity ratio 51.5%7.4%
- 8Arm Norway ASequity ratio 48.8%6.6%
- 9Sony Music Entertainment Norway ASequity ratio 48.0%6.0%
- 10Stratsys Norge ASequity ratio 33.4%5.1%
Better than the sector: operating margin at or above the sector median and no loss or negative equity. Weaker: operating margin below the median and a loss or negative equity. Otherwise about the same as the sector. Methodology
Drivers in the sector
Interest rates, prices and exchange rates that shape the sector's year, next to the sector's median operating margin. The drivers are context and are not part of the index.
USD/NOK (kr)
USD/NOK fell 3.3% in 2025; the sector's median operating margin rose 0.4 percentage points.
| Measure | 2021 | 2022 | 2023 | 2024 | 2025 | 2026 |
|---|---|---|---|---|---|---|
| USD/NOK, annual average | 8.59 | 9.61 | 10.56 | 10.75 | 10.39 | 9.54 (so far) |
| Change from the year before | −8.8% | +11.9% | +9.9% | +1.7% | −3.3% | −8.2% |
| Sector's median operating margin | – | 6.1% | 5.2% | 5.2% | 5.7% | 4.1% |
Source: Norges Bank (EXR, NLOD 2.0). Source · fetched 3 November 2026
Policy rate (prosent)
Policy rate fell 0.20 percentage points in 2025; the sector's median operating margin rose 0.4 percentage points.
| Measure | 2021 | 2022 | 2023 | 2024 | 2025 | 2026 |
|---|---|---|---|---|---|---|
| Policy rate, annual average | 0.08 | 1.32 | 3.54 | 4.50 | 4.30 | 4.17 (so far) |
| Change from the year before | −0.28 percentage points | +1.24 percentage points | +2.22 percentage points | +0.96 percentage points | −0.20 percentage points | −0.12 percentage points |
| Sector's median operating margin | – | 6.1% | 5.2% | 5.2% | 5.7% | 4.1% |
Source: Norges Bank (IR, NLOD 2.0). Source · fetched 3 November 2026
Consumer price index (indeks (2025 = 100))
Consumer price index rose 3.0% in 2025; the sector's median operating margin rose 0.4 percentage points.
| Measure | 2021 | 2022 | 2023 | 2024 | 2025 | 2026 |
|---|---|---|---|---|---|---|
| Consumer price index, annual average | 84.3 | 89.2 | 94.1 | 97.0 | 100.0 | 102.9 (so far) |
| Change from the year before | +3.5% | +5.8% | +5.5% | +3.2% | +3.0% | +2.9% |
| Sector's median operating margin | – | 6.1% | 5.2% | 5.2% | 5.7% | 4.1% |
Source: SSB (14710, CC BY 4.0). Source · fetched 3 November 2026
When USD/NOK fell in 2025, 1,127 of 2,147 ranked companies kept their operating margin at or above the year before. Among the largest: Telenor Norge AS (19.4% → 21.9%), Telia Norge AS (2.4% → 20.2%), Norsk Rikskringkasting AS (−3.3% → −1.6%), TV 2 AS (3.0% → 3.8%), Tiktok Norway AS (6.9% → 7.8%).
We show the drivers and the margin side by side and claim no cause. Sensitivity per company is not computed until we have at least 10 years of accounts per company: with three years such figures are false precision.
The sector in Norway (SSB)
The whole industry as Statistics Norway counts it: every enterprise, not only the limited companies we rank. Use these figures as background for the ranking above.
Enterprises, employment and turnover · 2024
- Enterprises
- 23,538
- +3.5% from 2023
- Persons employed
- 113,952
- +0.6% from 2023
- Turnover
- NOK 424.7 bn
- +10.2% from 2023
- Gross operating margin
- 14.6%
- Gross operating surplus divided by turnover
All enterprises, sole proprietorships included.
Bankruptcies in the industry
156 enterprise bankruptcies in the last four quarters (2025K4–2026K3). Change −13.8% against the four quarters before (181). That is about 6.6 per 1,000 enterprises.
Foreign-controlled enterprises · 2024
- Share of enterprises
- 5.7%
- Share of persons employed
- 40.1%
- Share of turnover
- 50.3%
SSB publishes this for groups of industries only. The figures are for the group “Informasjon og kommunikasjon”.
Turnover index · Informasjon og kommunikasjon
142.3 index, 2021 = 100, seasonally adjusted · 2026M08
+0.9% against 2025M08.
Monthly, 2023M08 to 2026M08.
Source: Statistics Norway (SSB), table 12910, table 10790, table 08085, table 13863. CC BY 4.0. Our industry codes (SN2025) are linked to SSB’s (SN2007) with SSB’s correspondence table in Klass.
Latest bankruptcies and liquidations
- TO BE OR Not AS 972408654 Voluntary liquidation · 3 November 2026 · 0 MNOK (2025)
- Fmiopt AS 836010302 Voluntary liquidation · 2 November 2026 · 0 MNOK (2025)
- Scientio AS 928658678 Forced dissolution · 2 November 2026 · 0 MNOK (2023)
- Seko Data AS 984603509 Bankruptcy · 2 November 2026 · 0 MNOK (2025)
- TRUST IT. AS 988530956 Bankruptcy · 2 November 2026 · 0 MNOK (2024)
- Xybel AS 921902050 Voluntary liquidation · 2 November 2026 · 1 MNOK (2025)
- Cousin AS 935903386 Voluntary liquidation · 31 October 2026
- Fintech Solutions AS 923534881 Voluntary liquidation · 31 October 2026 · 1 MNOK (2025)
Industry codes (NACE)
| Code | Description |
|---|---|
| 58* | Hele hovedgruppe 58 |
| 58.110 | Utgivelse av bøker |
| 58.120 | Utgivelse av aviser |
| 58.130 | Utgivelse av blader og tidsskrifter |
| 58.190 | Utgivelsesvirksomhet ellers, unntatt utgivelse av programvare |
| 58.210 | Utgivelse av programvare for dataspill |
| 58.290 | Utgivelse av annen programvare |
| 59* | Hele hovedgruppe 59 |
| 59.110 | Produksjon av film, video og fjernsynsprogrammer |
| 59.120 | Etterarbeid knyttet til produksjon av film, video og fjernsynsprogrammer |
| 59.130 | Distribusjon av film og video |
| 59.140 | Filmfremvisning |
| 59.200 | Produksjon og utgivelse av musikk- og lydopptak |
| 60* | Hele hovedgruppe 60 |
| 60.100 | Radiokringkasting og distribuering av musikk og andre lydmedier |
| 60.200 | Fjernsynsprogramvirksomhet, kringkasting og distribuering av audiovisuelle medier |
| 60.310 | Nyhetsbyråvirksomhet |
| 60.390 | Annen virksomhet for distribuering av innhold |
| 61* | Hele hovedgruppe 61 |
| 61.100 | Kabelbasert, satellittbasert og trådløs telekommunikasjon |
| 61.200 | Videresalg av telekommunikasjon og formidlingstjenester tilknyttet telekommunikasjon |
| 61.900 | Telekommunikasjon ellers |
| 62* | Hele hovedgruppe 62 |
| 62.100 | Dataprogrammeringstjenester |
| 62.200 | Konsulentvirksomhet tilknyttet informasjonsteknologi og forvaltning og drift av it-systemer |
| 62.900 | Andre tjenester tilknyttet informasjonsteknologi |
| 63* | Hele hovedgruppe 63 |
| 63.100 | Datainfrastruktur, -behandling, -lagring og tilknyttede tjenester |
| 63.910 | Drift av søkemotorer |
| 63.920 | Andre informasjonstjenester |