The municipalities growing and shrinking the most
Change in population over the last year.
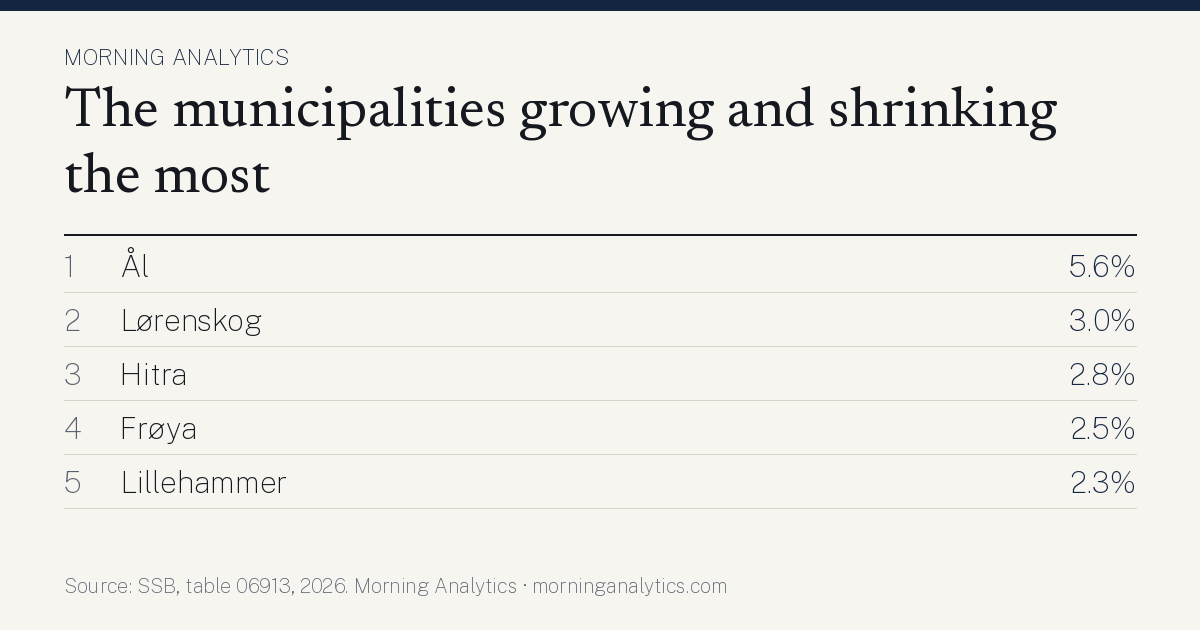
Ål has the highest population growth of Norway's municipalities at 5.6% (2026). The lowest is Sel at −2.7%. Source: SSB, table 06913, processed by Morning Analytics 5 November 2026.
Download the table (CSV) Sharing image (PNG)
The picture in figures
The bars show the ten highest and the ten lowest of 183 municipalities. The dashed line is the median of all municipalities.
Each bar is the number of municipalities in a range of values. The dashed line is the median. Hover over a bar to see the range.
Analysis: why are some at the top and others at the bottom?
We compared population growth with every other municipal figure we have, from Statistics Norway, NIPH and the Brønnøysund Register Centre. Below are the figures that go most closely together with population growth across the country, and what marks the municipalities at the top and bottom on those figures.
The pattern across the country
- Municipalities that rank high on «Net domestic migration per 1,000 inhabitants» most often also rank high on population growth (strong association, rank correlation 0.60 across 182 municipalities; Statistics Norway table 09588).
- Municipalities that rank high on «Share aged 67 and over» most often rank low on population growth (strong association, rank correlation −0.58 across 183 municipalities; Statistics Norway table 11805).
- Municipalities that rank high on «Share aged 80 and over» most often rank low on population growth (strong association, rank correlation −0.57 across 183 municipalities; Statistics Norway table 07459).
- Municipalities that rank high on «Natural increase per 1,000 inhabitants» most often also rank high on population growth (strong association, rank correlation 0.57 across 183 municipalities; Statistics Norway table 06913).
The highest and the lowest
- No. 1 Ål (5.6%) The municipality does not stand out on the figures that otherwise go together with the measure. The explanation probably lies in something we have no figures for. Goes against the pattern: «Net domestic migration per 1,000 inhabitants» −9.10 per 1,000 (no. 305 of 351 from the top; Statistics Norway table 09588). Most distinctive industry: oppføring av bygninger, 5% of the jobs, 2.1 times the national share (Statistics Norway table 13470, 2025).
- No. 2 Lørenskog (3.0%) Fits the pattern: «Natural increase per 1,000 inhabitants» 6.90 per 1,000 (no. 3 of 357 from the top; Statistics Norway table 06913); «Net domestic migration per 1,000 inhabitants» 18.44 per 1,000 (no. 8 of 351 from the top; Statistics Norway table 09588); «Share aged 67 and over» 13.7% (no. 348 of 357 from the top; Statistics Norway table 11805). Most distinctive industry: post og distribusjonsvirksomhet, 6% of the jobs, 10.4 times the national share (Statistics Norway table 13470, 2025).
- No. 3 Hitra (2.8%) Fits the pattern: «Net domestic migration per 1,000 inhabitants» 11.27 per 1,000 (no. 41 of 351 from the top; Statistics Norway table 09588); «Share aged 67 and over» 17.9% (no. 281 of 357 from the top; Statistics Norway table 11805). Most distinctive industry: produksjon av nærings- og nytelsesmidler, 21% of the jobs, 12.4 times the national share (Statistics Norway table 13470, 2025).
- No. 183 Sel (−2.7%, among the lowest) Fits the pattern: «Net domestic migration per 1,000 inhabitants» −29.70 per 1,000 (no. 334 of 351 from the top; Statistics Norway table 09588); «Share aged 67 and over» 25.3% (no. 47 of 357 from the top; Statistics Norway table 11805); «Share aged 80 and over» 8.1% (no. 52 of 357 from the top; Statistics Norway table 07459). Most distinctive industry: landtransport og rørtransport, 5% of the jobs, 2.2 times the national share (Statistics Norway table 13470, 2025).
- No. 182 Sunndal (−1.4%, among the lowest) Fits the pattern: «Net domestic migration per 1,000 inhabitants» −15.43 per 1,000 (no. 316 of 351 from the top; Statistics Norway table 09588). Most distinctive industry: produksjon av metaller, 26% of the jobs, 68.3 times the national share (Statistics Norway table 13470, 2025).
- No. 181 Volda (−1.1%, among the lowest) Fits the pattern: «Net domestic migration per 1,000 inhabitants» −14.10 per 1,000 (no. 313 of 351 from the top; Statistics Norway table 09588). Goes against the pattern: «Natural increase per 1,000 inhabitants» 1.89 per 1,000 (no. 70 of 357 from the top; Statistics Norway table 06913). Most distinctive industry: undervisning, 16% of the jobs, 2.0 times the national share (Statistics Norway table 13470, 2025).
The analysis describes what goes together, not what causes what. Two figures can follow each other because both depend on something else, such as size, location or industry. The figures are from the latest year available for each source, so the years can differ. Rank correlation runs from −1 to 1; values near 1 mean the municipalities lie in roughly the same order on both measures.
What explains the placing?
- 1. Ål 5.6% 1,111% above the median of the municipalities.
- 2. Lørenskog 3.0% 547% above the median of the municipalities.
- 3. Hitra 2.8% 514% above the median of the municipalities.
- 181. Volda −1.1% 337% below the median of the municipalities.
- 182. Sunndal −1.4% 397% below the median of the municipalities.
- 183. Sel −2.7% 692% below the median of the municipalities.
| # | Municipality | population growth |
|---|---|---|
| 101 | Porsgrunn | 0.4% |
| 102 | Randaberg | 0.4% |
| 103 | Molde | 0.4% |
| 104 | Alver | 0.4% |
| 105 | Målselv | 0.4% |
| 106 | Levanger | 0.4% |
| 107 | Vågan | 0.3% |
| 108 | Gjerdrum | 0.3% |
| 109 | Alstahaug | 0.3% |
| 110 | Larvik | 0.3% |
| 111 | Holmestrand | 0.3% |
| 112 | Tysvær | 0.3% |
| 113 | Narvik | 0.3% |
| 114 | Løten | 0.3% |
| 115 | Averøy | 0.3% |
| 116 | Sveio | 0.2% |
| 117 | Orkland | 0.2% |
| 118 | Gran | 0.2% |
| 119 | Vestvågøy | 0.2% |
| 120 | Nes | 0.2% |
| 121 | Midt-Telemark | 0.2% |
| 122 | Sør-Odal | 0.2% |
| 123 | Oppdal | 0.2% |
| 124 | Elverum | 0.2% |
| 125 | Verdal | 0.1% |
| 126 | Harstad | 0.1% |
| 127 | Halden | 0.1% |
| 128 | Ørsta | 0.1% |
| 129 | Stryn | 0.1% |
| 130 | Søndre Land | 0.1% |
| 131 | Hå | 0.1% |
| 132 | Melhus | 0.1% |
| 133 | Arendal | 0.1% |
| 134 | Skien | 0.1% |
| 135 | Vefsn | 0.0% |
| 136 | Brønnøy | 0.0% |
| 137 | Nittedal | 0.0% |
| 138 | Voss | 0.0% |
| 139 | Sykkylven | 0.0% |
| 140 | Nærøysund | 0.0% |
| 141 | Senja | 0.0% |
| 142 | Rauma | 0.0% |
| 143 | Jevnaker | 0.0% |
| 144 | Risør | −0.1% |
| 145 | Øyer | −0.1% |
| 146 | Sør-Varanger | −0.2% |
| 147 | Bodø | −0.2% |
| 148 | Steinkjer | −0.2% |
| 149 | Tinn | −0.3% |
| 150 | Vestre Toten | −0.3% |
Not ranked because the municipality has fewer than 5,000 inhabitants, where a few people can move the figure a lot (174): Alvdal (−0.7%), Andøy (−0.4%), Aremark (0.6%), Askvoll (−0.2%), Aukra (0.6%), Aure (−0.7%), Aurland (1.6%), Austrheim (1.1%), Bardu (1.1%), Beiarn (−2.5%), Berlevåg (−2.9%), Bindal (−0.9%), Bjerkreim (−0.4%), Bokn (1.6%), Bremanger (0.6%), Bygland (0.4%), Bykle (1.7%), Båtsfjord (−0.1%), Bø (−0.3%), Dovre (0.3%), Drangedal (−0.3%), Dyrøy (0.7%), Dønna (−0.1%), Eidfjord (1.9%), Engerdal (−2.9%), Etne (0.5%), Etnedal (27.0%), Evenes (2.6%), Evje og Hornnes (0.4%), Fedje (1.5%), Fitjar (0.9%), Fjaler (0.8%), Fjord (1.6%), Flakstad (−2.4%), Flatanger (−1.0%), Flesberg (−0.3%), Flå (0.4%), Folldal (−1.0%), Frosta (0.2%), Fyresdal (1.4%) …