Most and fewest with persistent low income
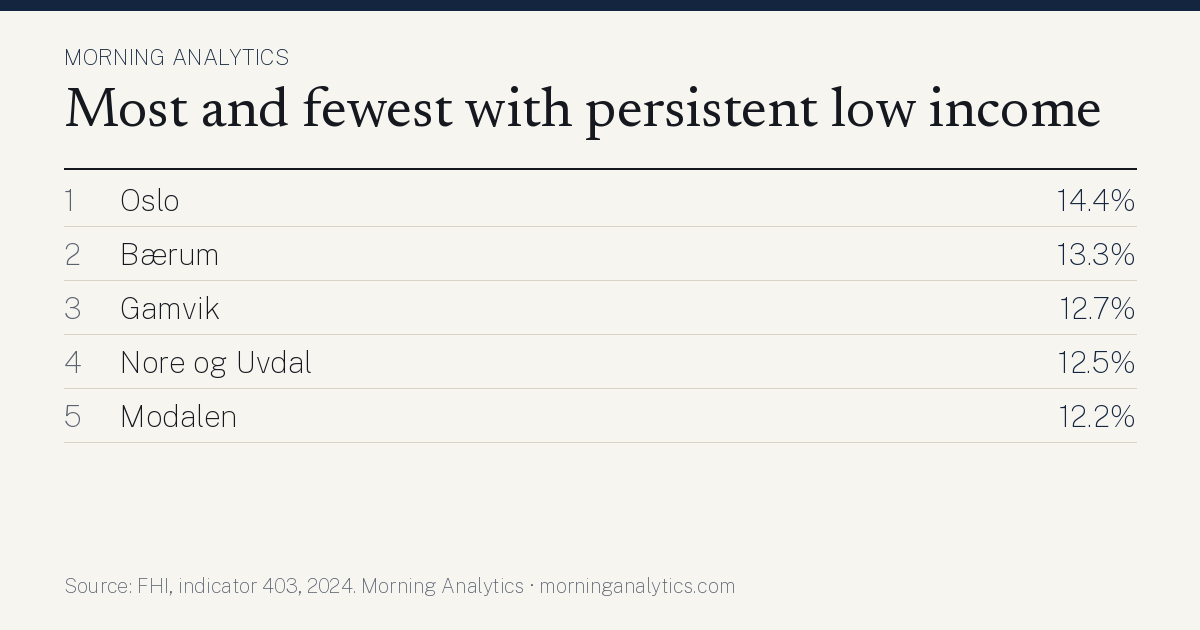
The share living in households with income below 60 % of the median, three years in a row.
Oslo has the highest share with persistent low income of Norway's municipalities at 14.4% (2024). The lowest is Bindal at 4.9%. Source: FHI, indicator 403, processed by Morning Analytics 5 November 2026.
Download the table (CSV) Sharing image (PNG)
The picture in figures
The bars show the ten highest and the ten lowest of 357 municipalities. The dashed line is the median of all municipalities.
Each bar is the number of municipalities in a range of values. The dashed line is the median. Hover over a bar to see the range.
Analysis: why are some at the top and others at the bottom?
We compared share with persistent low income with every other municipal figure we have, from Statistics Norway, NIPH and the Brønnøysund Register Centre. Below are the figures that go most closely together with share with persistent low income across the country, and what marks the municipalities at the top and bottom on those figures.
The pattern across the country
- Municipalities that rank high on «Limited companies we follow per 1,000 inhabitants» most often also rank high on share with persistent low income (moderate association, rank correlation 0.41 across 347 municipalities; Brønnøysund Register Centre, our own calculations).
- Municipalities that rank high on «Share with upper secondary as highest education (16 and over)» most often rank low on share with persistent low income (moderate association, rank correlation −0.38 across 357 municipalities; Statistics Norway table 09429).
- Municipalities that rank high on «Disability benefit recipients aged 20–66 (standardised)» most often rank low on share with persistent low income (moderate association, rank correlation −0.35 across 357 municipalities; NIPH indicator 787).
- Municipalities that rank high on «Net expenditure on culture per inhabitant» most often also rank high on share with persistent low income (moderate association, rank correlation 0.32 across 357 municipalities; Statistics Norway table 13135).
The highest and the lowest
- No. 1 Oslo (14.4%) Fits the pattern: «Share with upper secondary as highest education (16 and over)» 22.7% (no. 357 of 357 from the top; Statistics Norway table 09429); «Disability benefit recipients aged 20–66 (standardised)» 7.0% (no. 345 of 357 from the top; NIPH indicator 787); «Limited companies we follow per 1,000 inhabitants» 93.47 per 1,000 (no. 27 of 347 from the top; Brønnøysund Register Centre, our own calculations). Most distinctive industry: tjenester tilknyttet informasjonsteknologi, 6% of the jobs, 2.6 times the national share (Statistics Norway table 13470, 2025).
- No. 2 Bærum (13.3%) Fits the pattern: «Disability benefit recipients aged 20–66 (standardised)» 4.7% (no. 357 of 357 from the top; NIPH indicator 787); «Share with upper secondary as highest education (16 and over)» 25.3% (no. 356 of 357 from the top; Statistics Norway table 09429); «Limited companies we follow per 1,000 inhabitants» 85.09 per 1,000 (no. 42 of 347 from the top; Brønnøysund Register Centre, our own calculations). Most distinctive industry: arkitektvirksomhet og teknisk konsulentvirksomhet, og teknisk prøving og analyse, 7% of the jobs, 3.4 times the national share (Statistics Norway table 13470, 2025).
- No. 3 Gamvik (12.7%) Fits the pattern: «Limited companies we follow per 1,000 inhabitants» 95.19 per 1,000 (no. 24 of 347 from the top; Brønnøysund Register Centre, our own calculations); «Share with upper secondary as highest education (16 and over)» 36.0% (no. 311 of 357 from the top; Statistics Norway table 09429); «Net expenditure on culture per inhabitant» 4,685 kr (no. 71 of 357 from the top; Statistics Norway table 13135). Most distinctive industry: fiske, fangst og akvakultur, 30% of the jobs, 37.6 times the national share (Statistics Norway table 13470, 2025).
- No. 357 Bindal (4.9%, among the lowest) Fits the pattern: «Disability benefit recipients aged 20–66 (standardised)» 13.4% (no. 70 of 357 from the top; NIPH indicator 787); «Limited companies we follow per 1,000 inhabitants» 49.96 per 1,000 (no. 263 of 347 from the top; Brønnøysund Register Centre, our own calculations); «Share with upper secondary as highest education (16 and over)» 44.5% (no. 90 of 357 from the top; Statistics Norway table 09429). Most distinctive industry: jordbruk og tjenester tilknyttet jordbruk, jakt og viltstell, 9% of the jobs, 7.4 times the national share (Statistics Norway table 13470, 2025).
- No. 356 Vågå (5.1%, among the lowest) Fits the pattern: «Share with upper secondary as highest education (16 and over)» 45.7% (no. 49 of 357 from the top; Statistics Norway table 09429). Goes against the pattern: «Limited companies we follow per 1,000 inhabitants» 72.61 per 1,000 (no. 86 of 347 from the top; Brønnøysund Register Centre, our own calculations). Most distinctive industry: elektrisitets-, gass-, damp- og varmtvannsforsyning, 6% of the jobs, 9.7 times the national share (Statistics Norway table 13470, 2025).
- No. 355 Hemnes (5.3%, among the lowest) Fits the pattern: «Limited companies we follow per 1,000 inhabitants» 37.00 per 1,000 (no. 334 of 347 from the top; Brønnøysund Register Centre, our own calculations); «Disability benefit recipients aged 20–66 (standardised)» 14.9% (no. 31 of 357 from the top; NIPH indicator 787). Most distinctive industry: jordbruk og tjenester tilknyttet jordbruk, jakt og viltstell, 6% of the jobs, 4.7 times the national share (Statistics Norway table 13470, 2025).
The analysis describes what goes together, not what causes what. Two figures can follow each other because both depend on something else, such as size, location or industry. The figures are from the latest year available for each source, so the years can differ. Rank correlation runs from −1 to 1; values near 1 mean the municipalities lie in roughly the same order on both measures.
What explains the placing?
- 1. Oslo 14.4% 78% above the median of the municipalities.
- 2. Bærum 13.3% 64% above the median of the municipalities.
- 3. Gamvik 12.7% Small municipality (1,019 inhabitants): one company or a few people can move the figure a lot. 58% above the median of the municipalities.
- 355. Hemnes 5.3% Small municipality (4,486 inhabitants): one company or a few people can move the figure a lot. 34% below the median of the municipalities.
- 356. Vågå 5.1% Small municipality (3,553 inhabitants): one company or a few people can move the figure a lot. 36% below the median of the municipalities.
- 357. Bindal 4.9% Small municipality (1,361 inhabitants): one company or a few people can move the figure a lot. 39% below the median of the municipalities.
| # | Municipality | share with persistent low income |
|---|---|---|
| 301 | Løten | 6.9% |
| 302 | Inderøy | 6.9% |
| 303 | Sula | 6.9% |
| 304 | Ringsaker | 6.8% |
| 305 | Hattfjelldalsmall municipality | 6.8% |
| 306 | Sveio | 6.8% |
| 307 | Vefsn | 6.8% |
| 308 | Åfjordsmall municipality | 6.8% |
| 309 | Tjeldsundsmall municipality | 6.7% |
| 310 | Rakkestad | 6.7% |
| 311 | Rauma | 6.7% |
| 312 | Nesbyensmall municipality | 6.7% |
| 313 | Strandasmall municipality | 6.7% |
| 314 | Våler (Østfold) | 6.7% |
| 315 | Stjørdal | 6.7% |
| 316 | Trysil | 6.7% |
| 317 | Gruesmall municipality | 6.7% |
| 318 | Sømnasmall municipality | 6.6% |
| 319 | Ørsta | 6.6% |
| 320 | Lekasmall municipality | 6.6% |
| 321 | Orkland | 6.6% |
| 322 | Rana | 6.6% |
| 323 | Lundsmall municipality | 6.6% |
| 324 | Markersmall municipality | 6.6% |
| 325 | Luster | 6.5% |
| 326 | Steinkjer | 6.5% |
| 327 | Gjerstadsmall municipality | 6.5% |
| 328 | Osterøy | 6.5% |
| 329 | Osensmall municipality | 6.5% |
| 330 | Sør-Aurdalsmall municipality | 6.4% |
| 331 | Vestre Toten | 6.4% |
| 332 | Sør-Odal | 6.4% |
| 333 | Granesmall municipality | 6.4% |
| 334 | Røros | 6.3% |
| 335 | Fauske | 6.3% |
| 336 | Frostasmall municipality | 6.3% |
| 337 | Ivelandsmall municipality | 6.2% |
| 338 | Nordre Land | 6.2% |
| 339 | Birkenes | 6.2% |
| 340 | Dovresmall municipality | 6.2% |
| 341 | Masfjordensmall municipality | 6.2% |
| 342 | Sel | 6.2% |
| 343 | Selbusmall municipality | 6.2% |
| 344 | Verdal | 6.0% |
| 345 | Holtålensmall municipality | 6.0% |
| 346 | Froland | 6.0% |
| 347 | Skaun | 6.0% |
| 348 | Vestre Slidresmall municipality | 5.9% |
| 349 | Snåsasmall municipality | 5.8% |
| 350 | Årdal | 5.8% |